Using Fidelity Trader+™ Web charts
With customizable chart indicators, automated pattern recognition software, and intuitive click-from-chart functionality, Fidelity Trader+™ Web can help you monitor, chart, and trade more confidently.
Follow our step-by-step guide to learn how to set up, customize, and trade from your Fidelity Trader+™ Web chart.
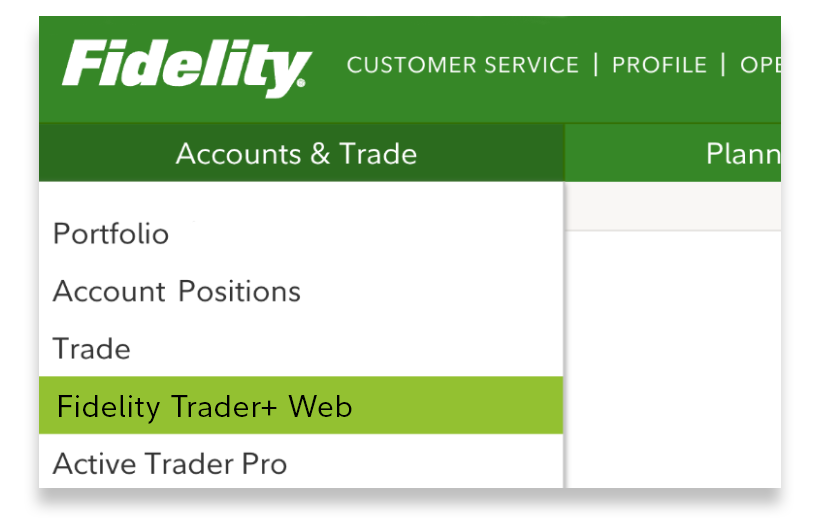
1. Log in to your Fidelity brokerage account. From Accounts & Trade, select Fidelity Trader+™ Web.

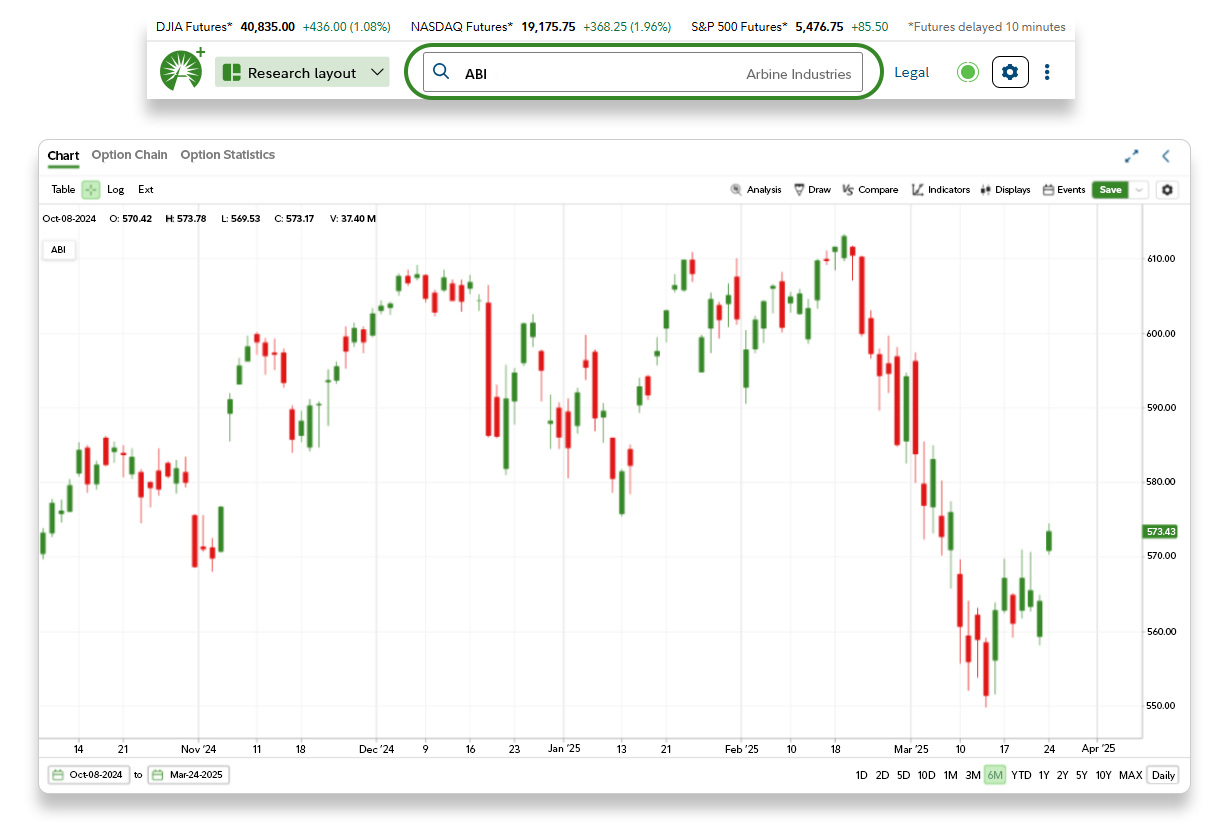
2. Enter the symbol of the stock, ETF, or index you want to analyze further and review the chart.

3. Adjust pricing data by scrolling or selecting the timeframe and frequency to align with your investment time horizon.

4. For shorter-term analysis, select “Ext” to view extended-hours pricing data, which reports trades occurring before and after normal market hours.
- This deeper insight into market pricing often helps shorter-term traders and those who monitor quarterly earnings reports or other major news headlines.

5. Add chart Indicators to quickly identify trading opportunities.
- Search for indicators by name or scroll through the Indicator library.
- Save any indicator to your Favorites for future use.

6. Select the information icon for a brief explanation of each technical indicator.

7. Adjust any default indicator parameters as necessary and apply the technical indicator to your chart.
- Investors often match the period, or number of data points included within the indicator’s calculation, with their investment time horizon.
- The default parameters and drop-down menus will vary by indicator.

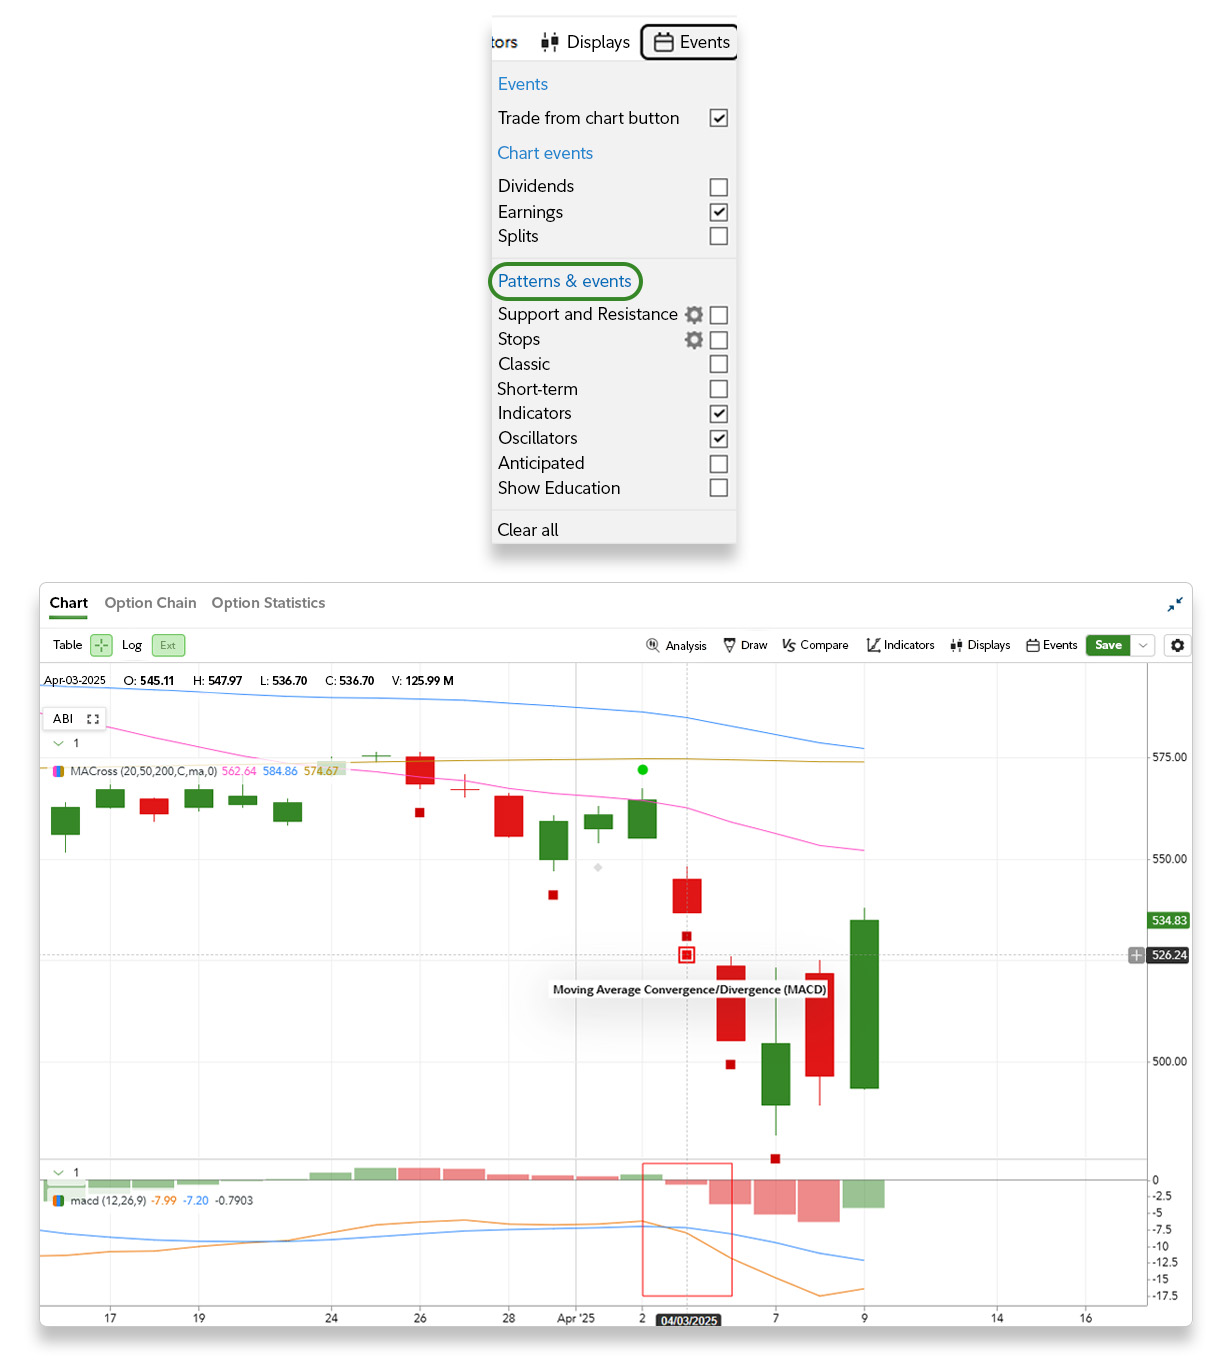
8. Add Patterns and events to enable automated pattern recognition and generate trading ideas faster.
- Green (bullish) and red (bearish) icons will appear above and below the chart prices.
- Click on any icon to add the corresponding indicator to your chart.

9. Save your chart to lock in your custom drawings, indicators, and settings.
- Accessing previously saved chart templates enables you to go from chart to trade faster, as your preferred settings are already in place.
- Maintaining consistent chart settings can help with comparing different assets under the same criteria, enabling a systematic trade process.

10. Right click anywhere on the chart to quickly initiate a trade.

11. Preview and place your order and execute your trading strategy.

Congratulations—you’re ready to monitor markets and trade in real time with Fidelity Trader+™ Web!
Now you're better equipped with the tools and insights needed to confidently navigate the markets. Start your trading journey today and take control of your financial future.


