
Description
The Double Smoothed Stochastic indicator was created by William Blau. It applies Exponential Moving Averages (EMAs) of two different periods to a standard Stochastic %K. The components that construct the Stochastic Oscillator are first smoothed with the two EMAs. Then, the smoothed components are plugged into the standard Stochastic formula to calculate the indicator.
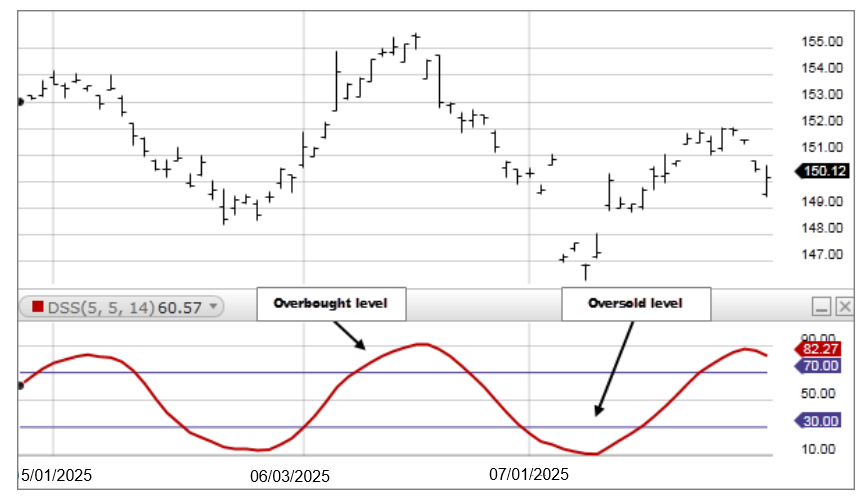
DSS ranges from 0 to 100, like the standard Stochastic Oscillator. The same rules of interpretation apply to Stochastics can be applied to DSS, although DSS offers a much smoother curve than the raw Stochastic.
- Generally, the area above 70 indicates an overbought region, while the area below 30 is considered an oversold region. A sell signal is given when the oscillator is above the 70 level and then crosses back below 70. Conversely, a buy signal is given when the oscillator is below 30 and then crossed back above 30. 70 and 30 are the most common levels used but can be adjusted as needed.
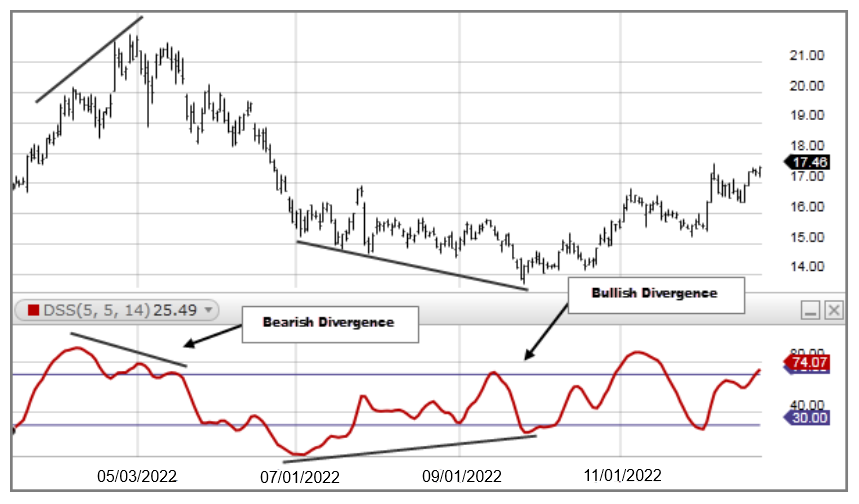
- Divergences form when a new high or low in price is not confirmed by the Stochastic Oscillator. A bullish divergence forms when price makes a lower low, but the Stochastic Oscillator forms a higher low. This indicates less downward momentum that could foreshadow a bullish reversal. A bearish divergence forms when price makes a higher high, but the Stochastic Oscillator forms a lower high. This shows less upward momentum that could foreshadow a bearish reversal.
EMA of the [EMA of the (Close – Lowest Low for the specified period)]
Divided by
EMA of the [EMA of the (Highest High for the specified period – Lowest Low for the specified period)]
X 100