
Description
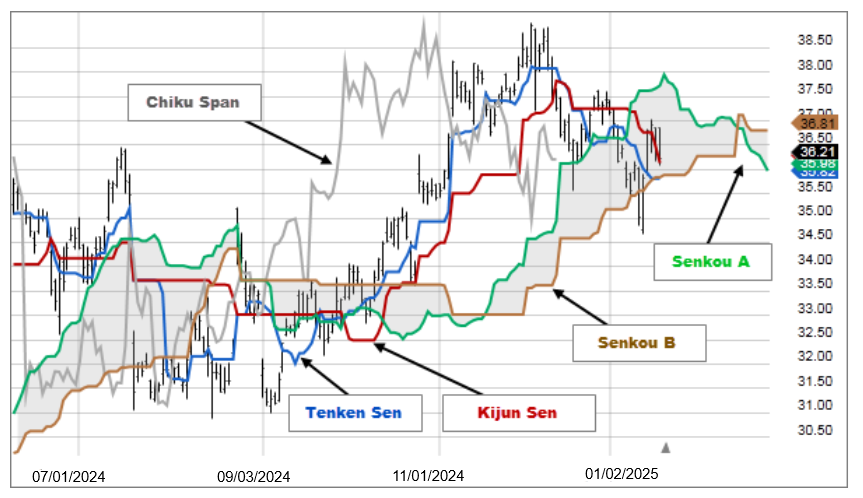
The Ichimoku Cloud is a type of chart used in technical analysis to display support and resistance, momentum, and trend in one view. TenkanSen and KijunSen are similar to moving averages and analyzed in relationship to one another. When the shorter term indicator, TenkanSen, rises above the longer term indicator, KijunSen, the securities trend is typically positive. When TenkanSen falls below KijunSen, the securities trend is typically negative. TenkanSen and KijunSen as a group are then analyzed in relationship to the Cloud, which is composed of the area between Senkou A and Senkou B.
- When TenkanSen and KijunSen are decidedly above the Cloud, the issue's trend is positive.
- When TenkanSen and KijunSen are decidedly below the Cloud, the issue's trend is negative.
- Using the Cloud to determine trend:
- When prices are above the cloud, the trend is up. When prices are below the cloud, the trend is down.
- When Sendou A is rising and above Senkou B, the uptrend is strengthening. When Senkou A is falling and below Senkou B, the downtrend is strengthening.
- A buy signal is reinforced when the Tenkan Sen crosses above the Kijun Sen while the Tenkan Sen, Kijun Sen, and price are all above the cloud.
- A sell signal is reinforced when the TenKan Sen crosses below the Kijun Sen while the Tenkan Sen, Kijun Sen, and price are all below the cloud.
There are five plots that make up the Ichimoku Cloud indicator. Their names and calculations are:
- TenkanSen (Conversion Line): (High + Low) / 2 default period = 9
- KijunSen (Base Line): (High + Low) / 2 default period = 26
- Chiku Span (Lagging Span): Price Close shifted back 26 bars
- Senkou A (Leading Span A): (TenkanSen + KijunSen) / 2 (Senkou A is shifted forward 26 bars)
- Senkou B (Leading Span B): (High + Low) / 2 using period = 52 (Senkou B is shifted forward 26 bars)