
Description
Pivot Points (High/Low), also known as Bar Count Reversals, are used to anticipate potential price reversals. Pivot Point Highs are determined by the number of bars with lower highs on either side of a Pivot Point High. Pivot Point Lows are determined by the number of bars with higher lows on either side of a Pivot Point Low.
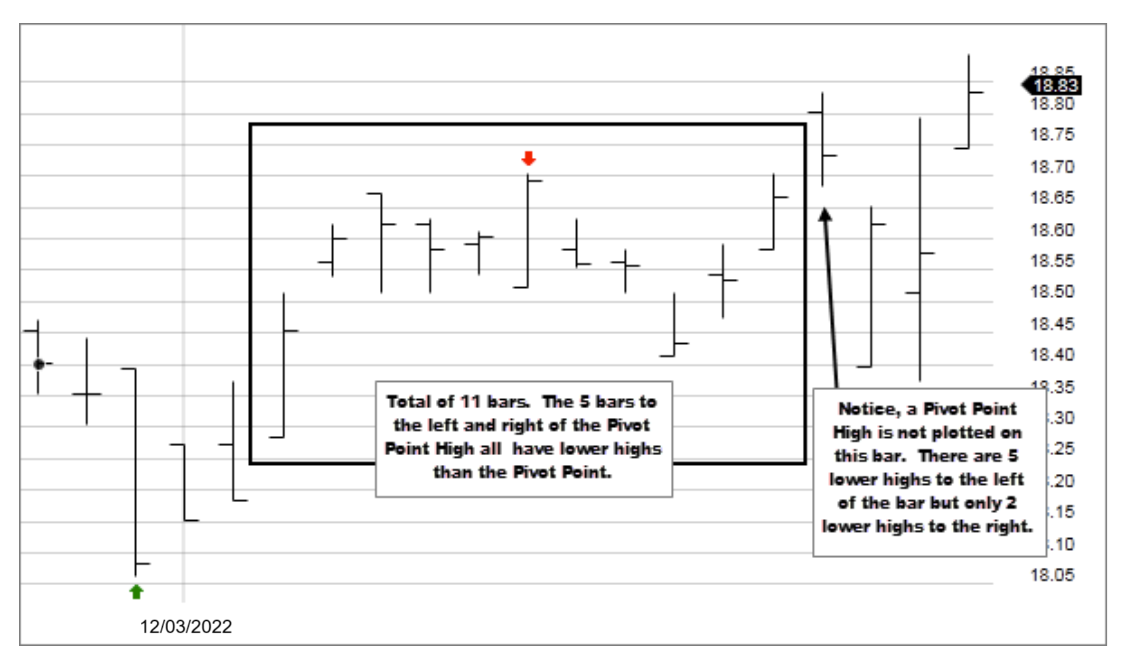
For example, a Pivot Point High, with a period of 5, requires a minimum of 11 bars to be considered a valid Pivot Point. A minimum of 5 bars before and after the Pivot Point High all have to have lower highs.
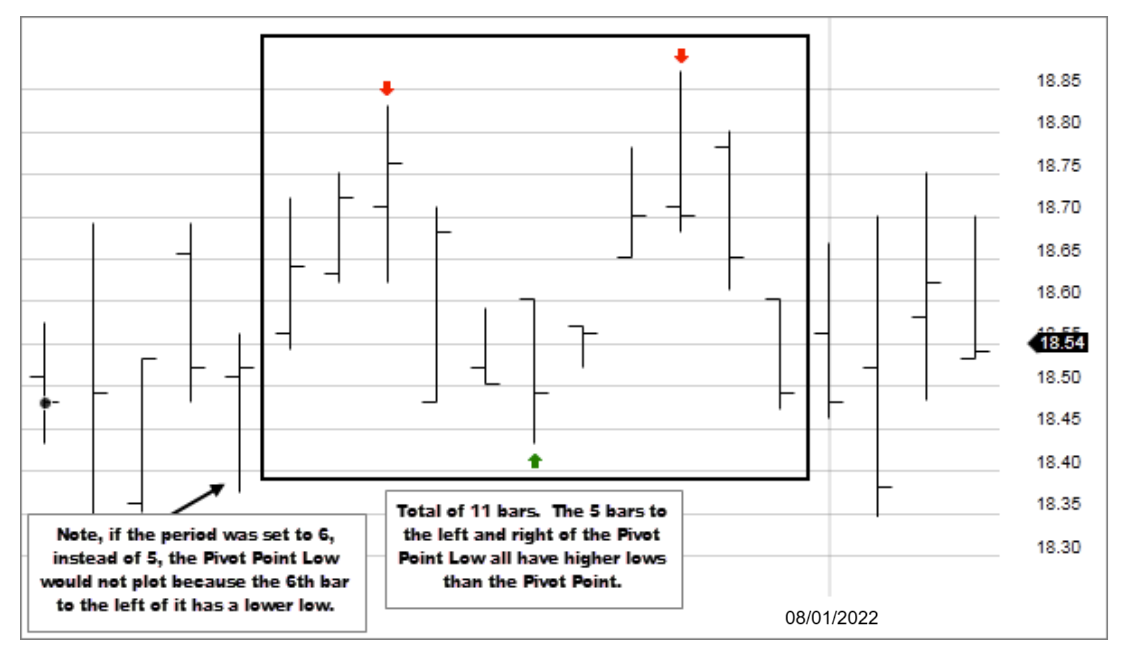
A Pivot Point Low, with a period of 5, requires a minimum of 5 bars before and after the Pivot Point Low to each have higher lows in order to be a valid Pivot Point.
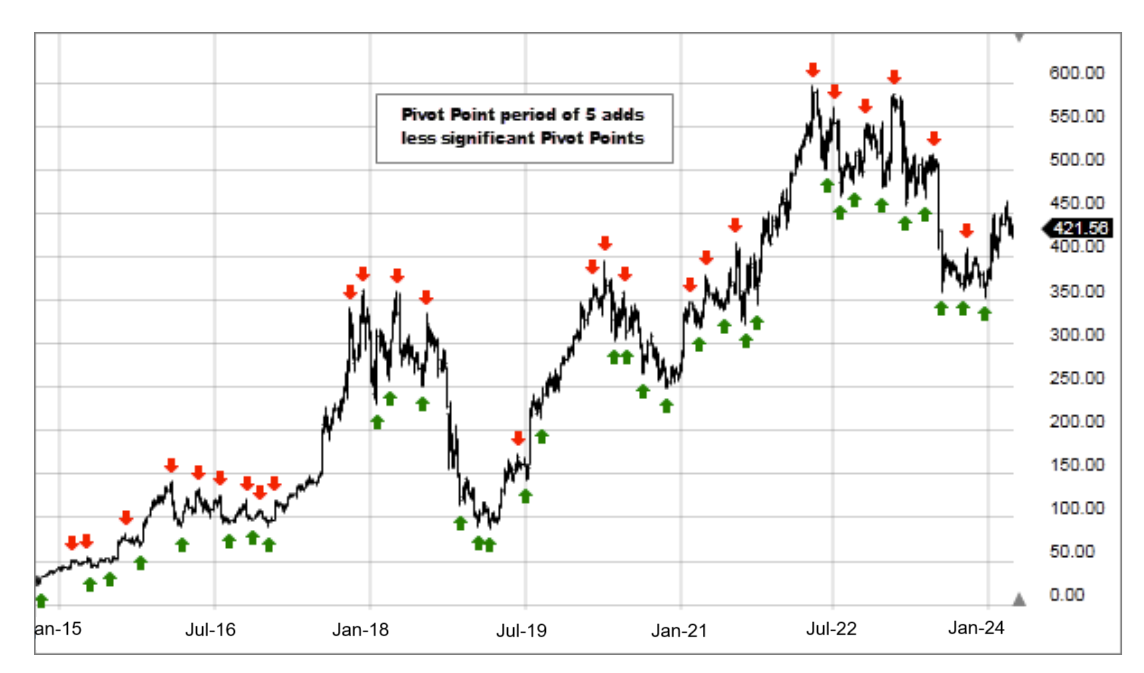
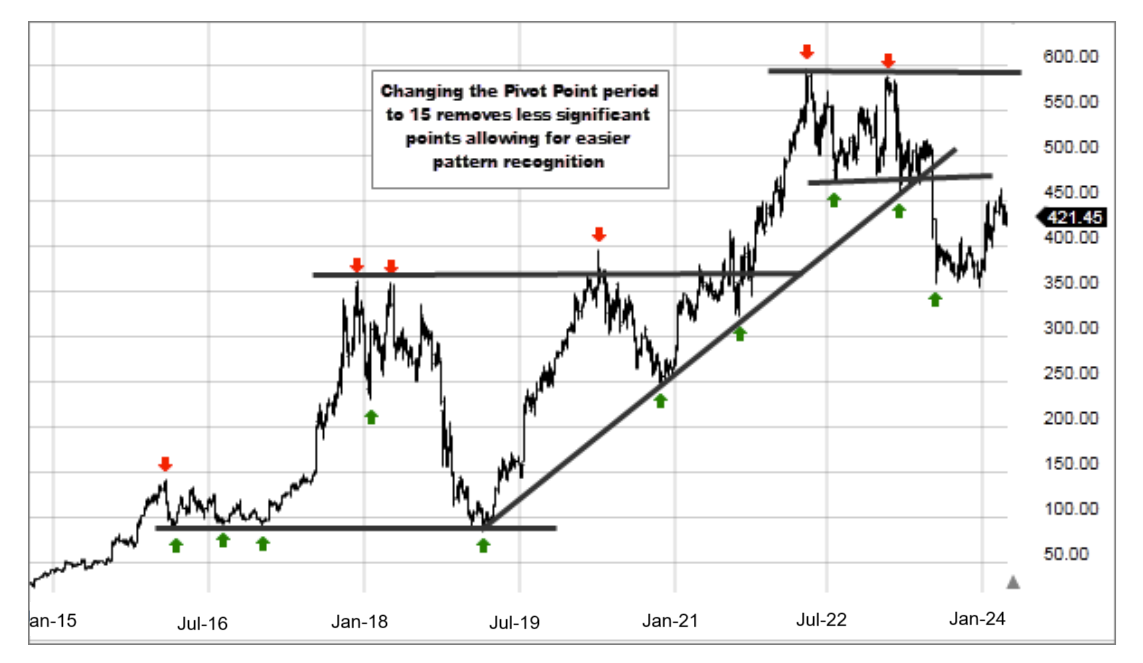
- The longer the trend (the higher the period selected) before and after the Pivot Point, the more significant the Pivot Point.
- Pivot Points can be used to help determine where to draw trendlines in order to visualize price patterns.
- Pivot Point Highs are determined by the number of bars with lower highs on either side of a Pivot Point High.
- Pivot Point Lows are determined by the number of bars with higher lows on either side of a Pivot Point Low.