Fixed Income Dashboard
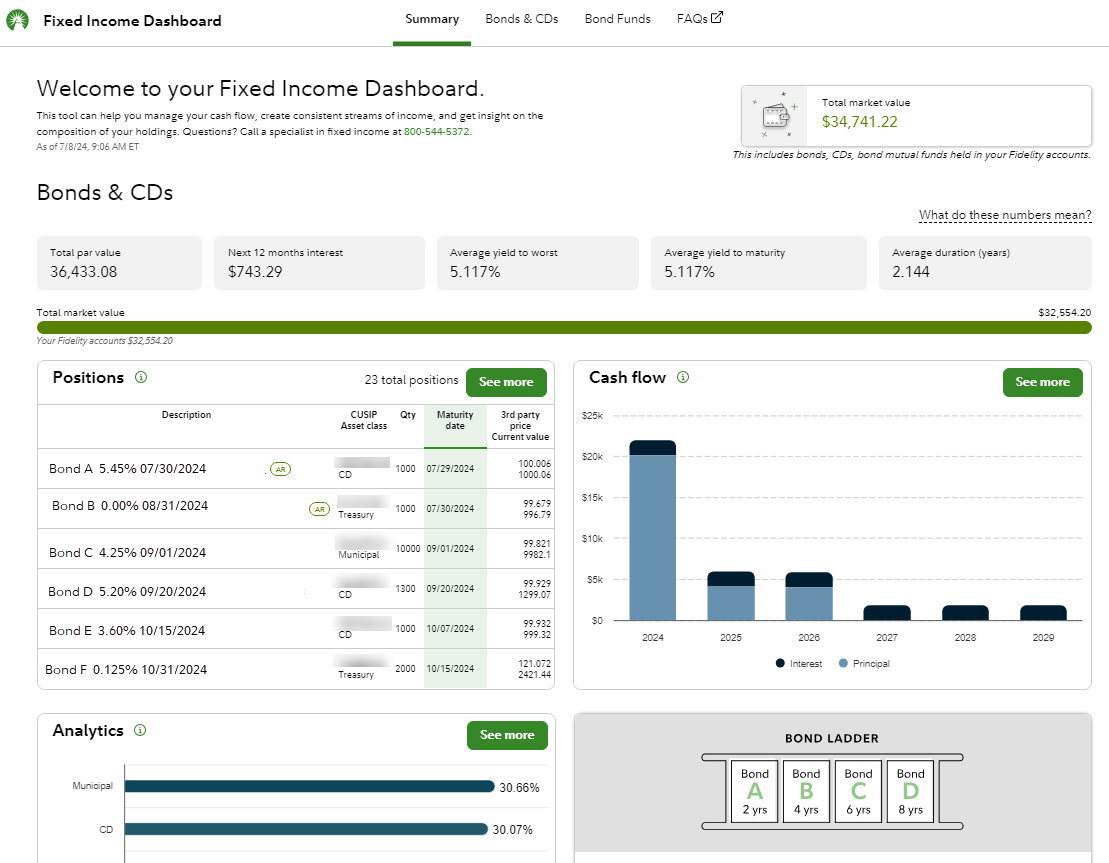
Fidelity's Fixed Income Dashboard can help you manage cash flow and understand the composition of your fixed income portfolio.
Questions?
- 800-544-5372 800-544-5372
- Chat with a representative
Key features
| Summary page |
|
|---|---|
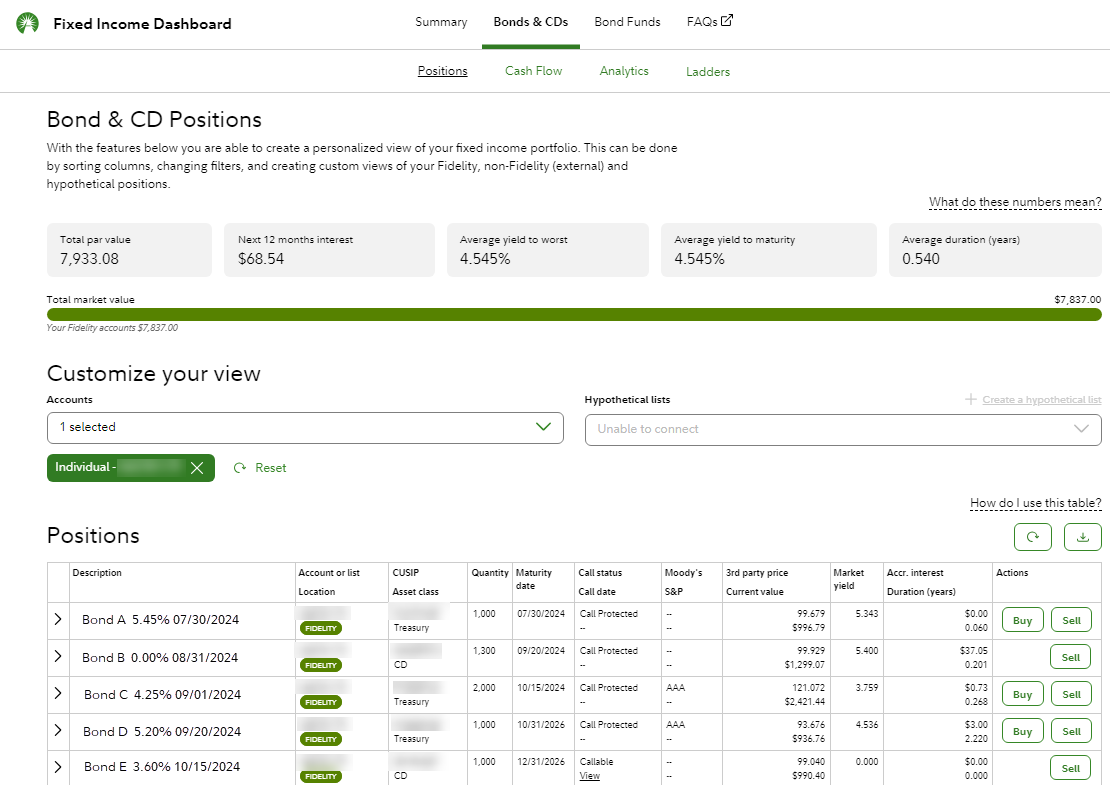
| Fixed income positions |
|
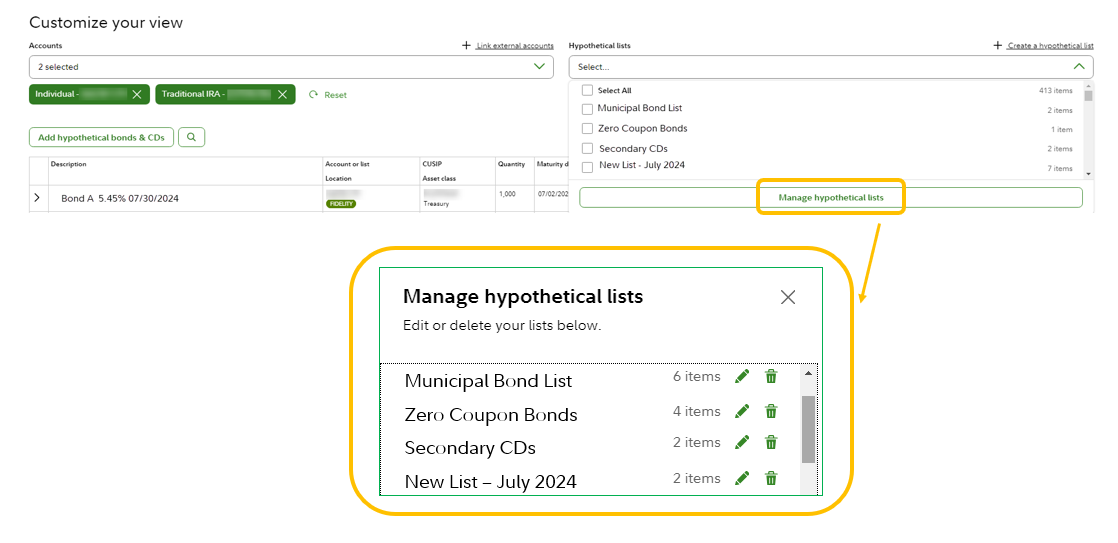
| Customize your view |
|
| Cash flow calculations |

|
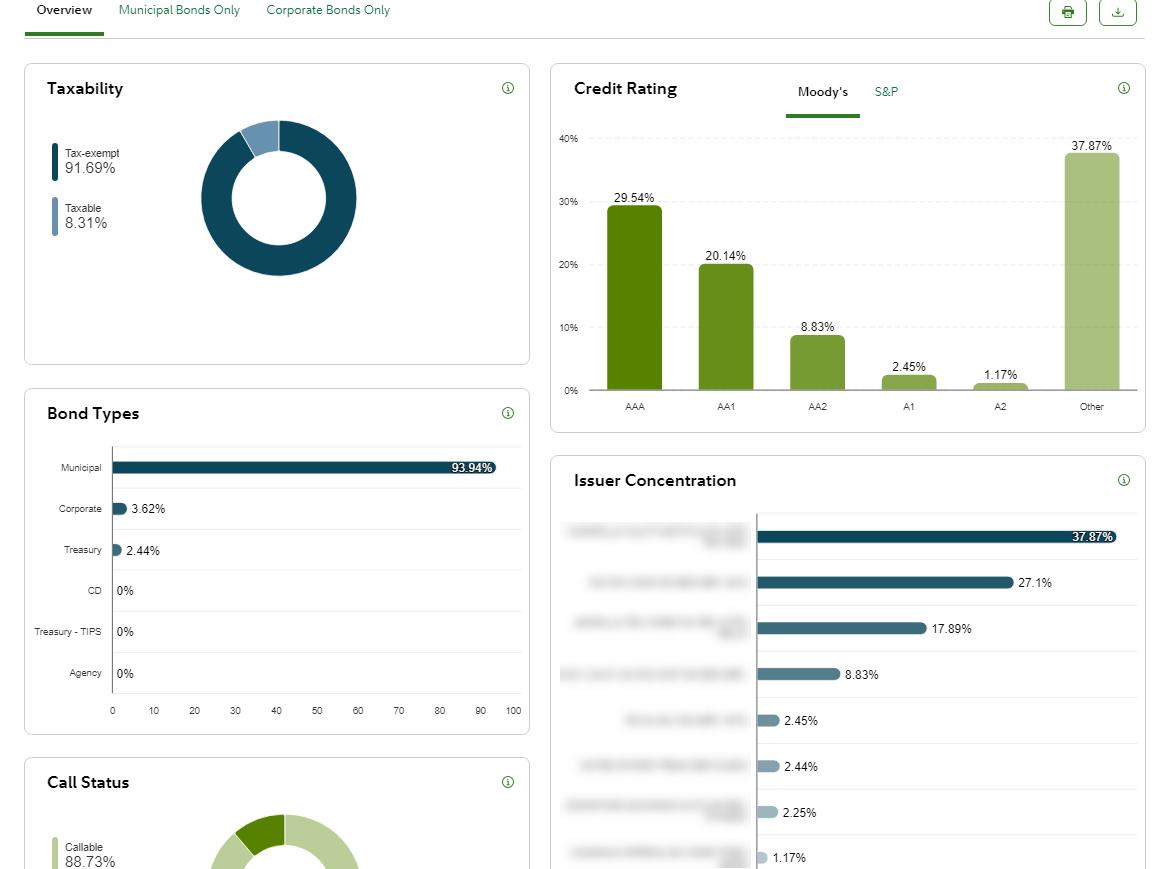
| Analytics |
The analytics charts can help you identify different types of risk or diversification opportunities within your portfolio, such as
|
Next step
Learn more