


In the investment world, graphing the yield to maturity across bonds of the same credit quality (like US Treasurys) creates a yield curve. Investors can use this visual to help determine which types of bonds make the most sense for their portfolio. This graph can also tell you a lot about the state of the US economy, especially if the yield curve inverts. The good news is you don’t have to be an economist to understand how an inverted yield curve works.
What is the yield curve?
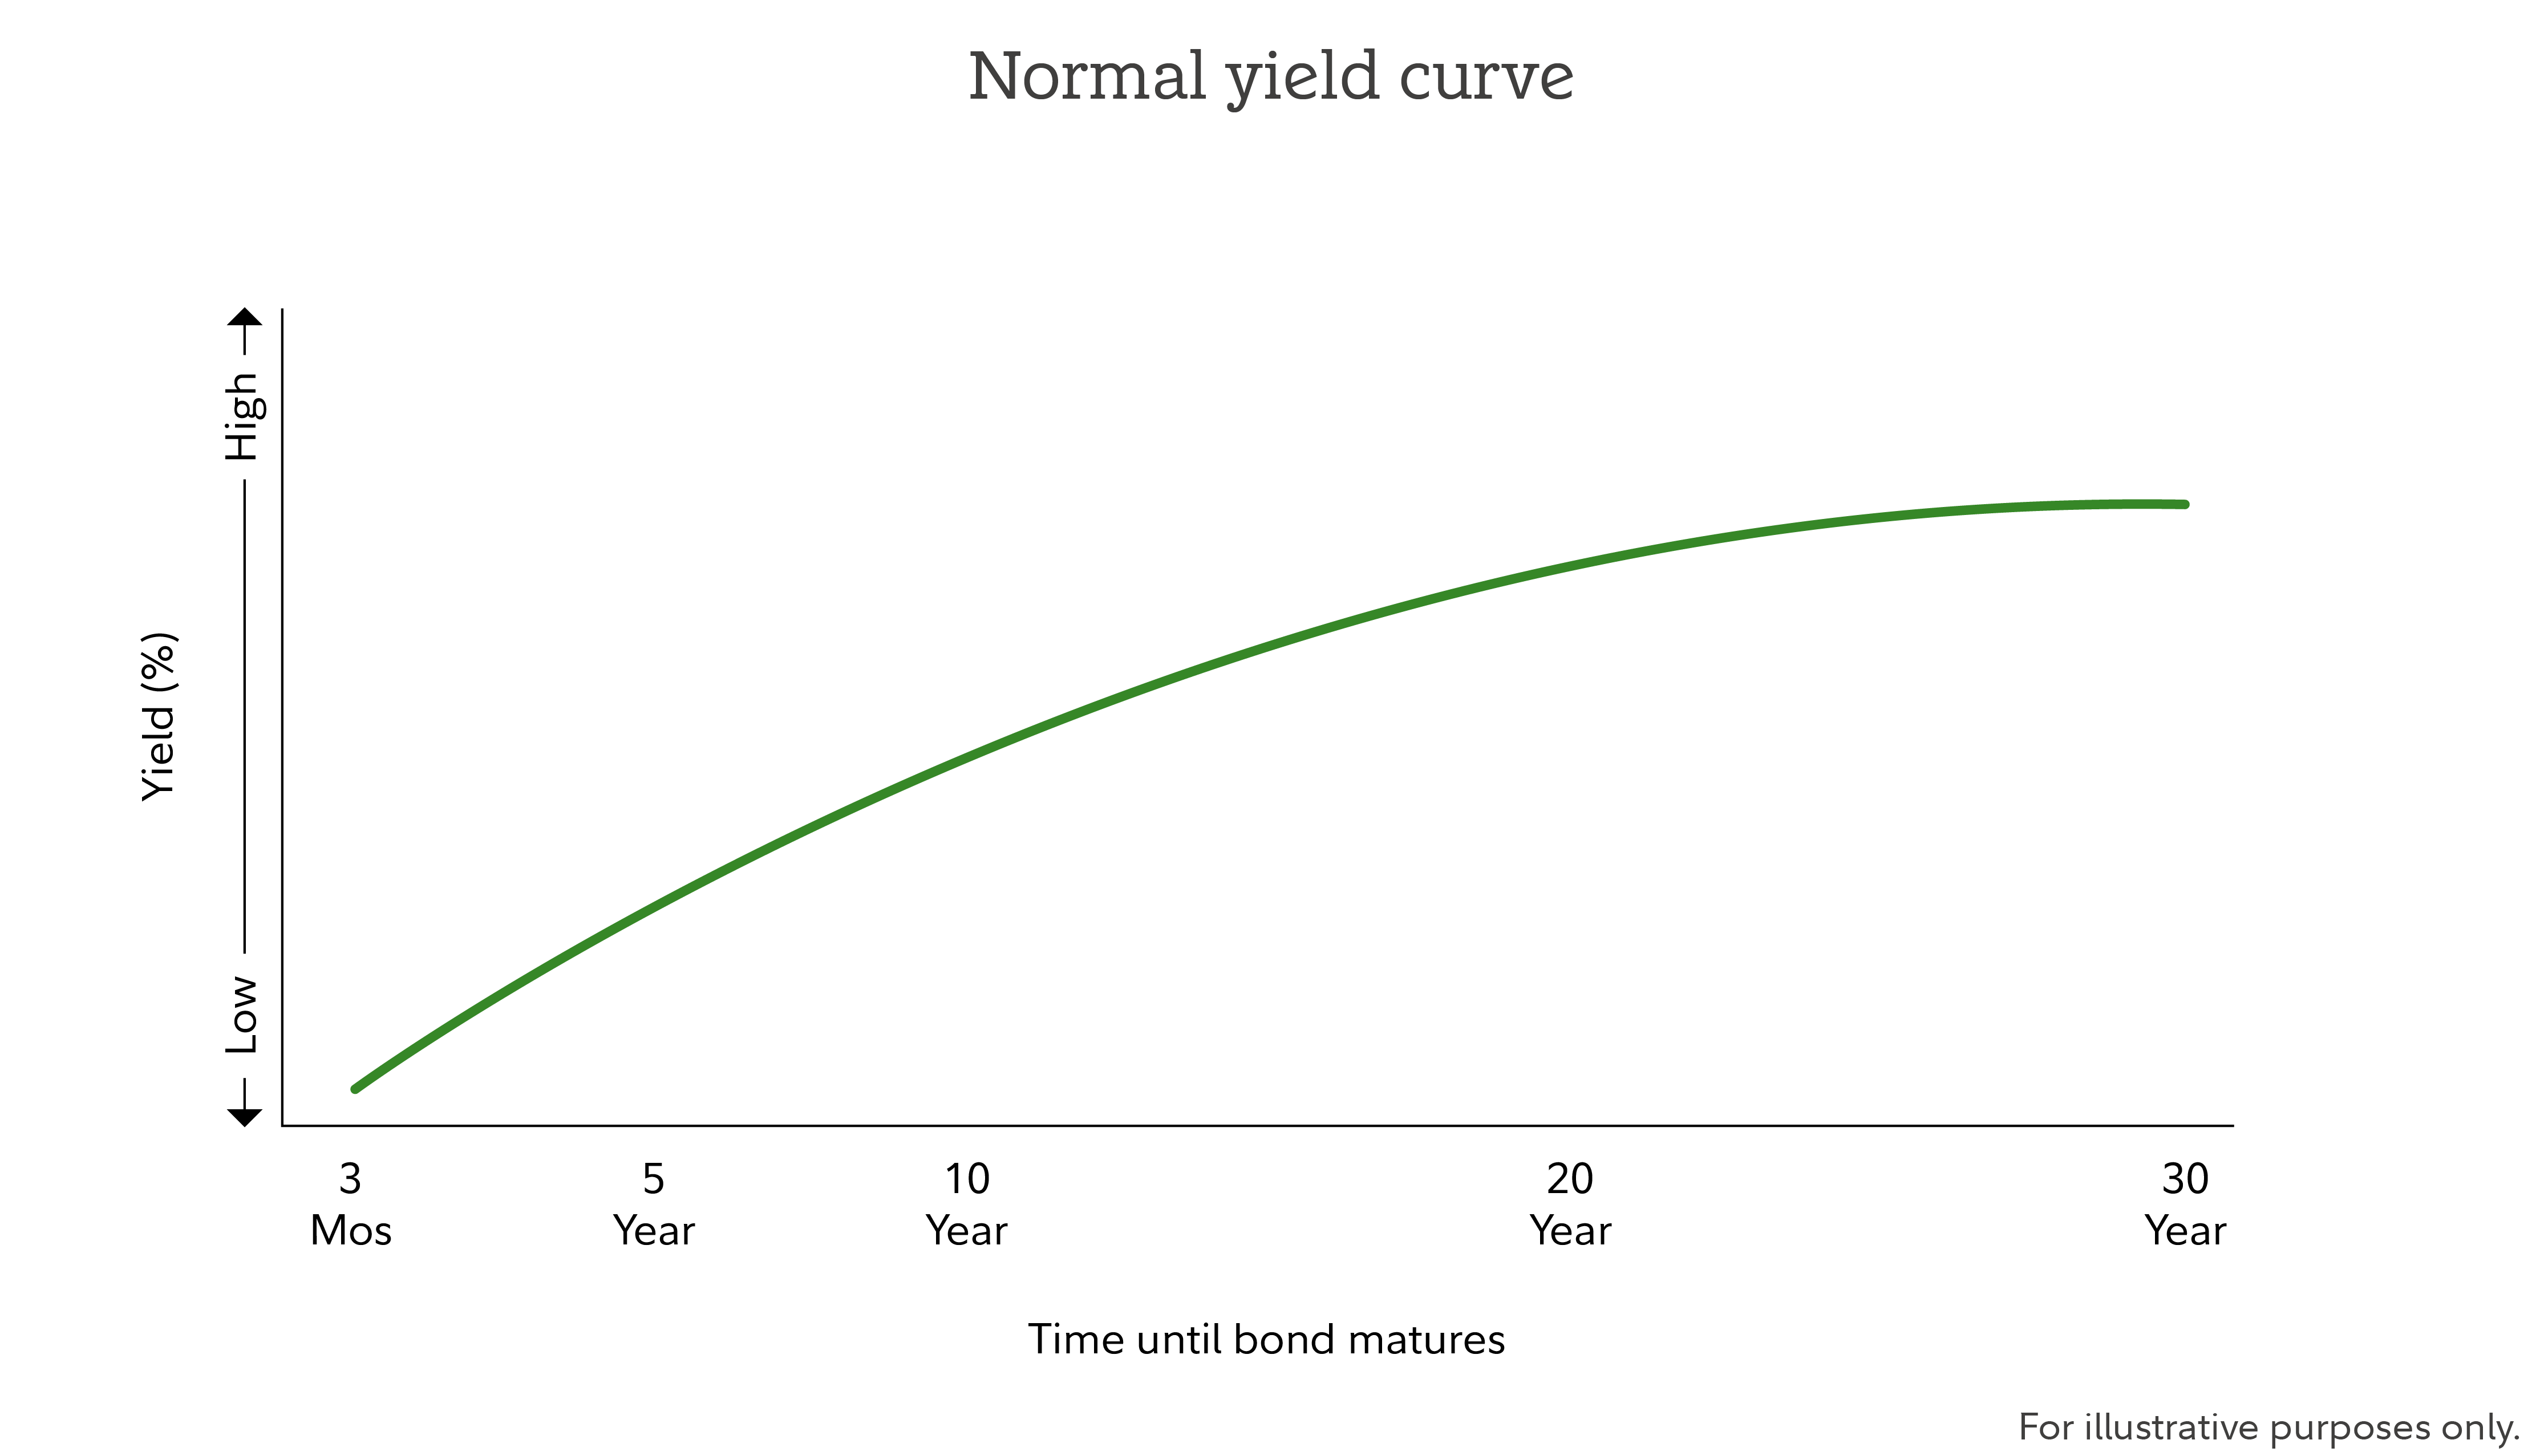
The yield curve is a line graph that represents bond investors’ feelings about risk. It shows how high bond yields are relative to the bonds’ maturity date. In a normal yield curve, yields rise more the further into the future maturity dates go. That’s because lending money for longer periods of time is generally considered riskier than lending for shorter periods of time, so investors demand a higher annual rate of return. This creates a curve that climbs upward.
What is an inverted yield curve?
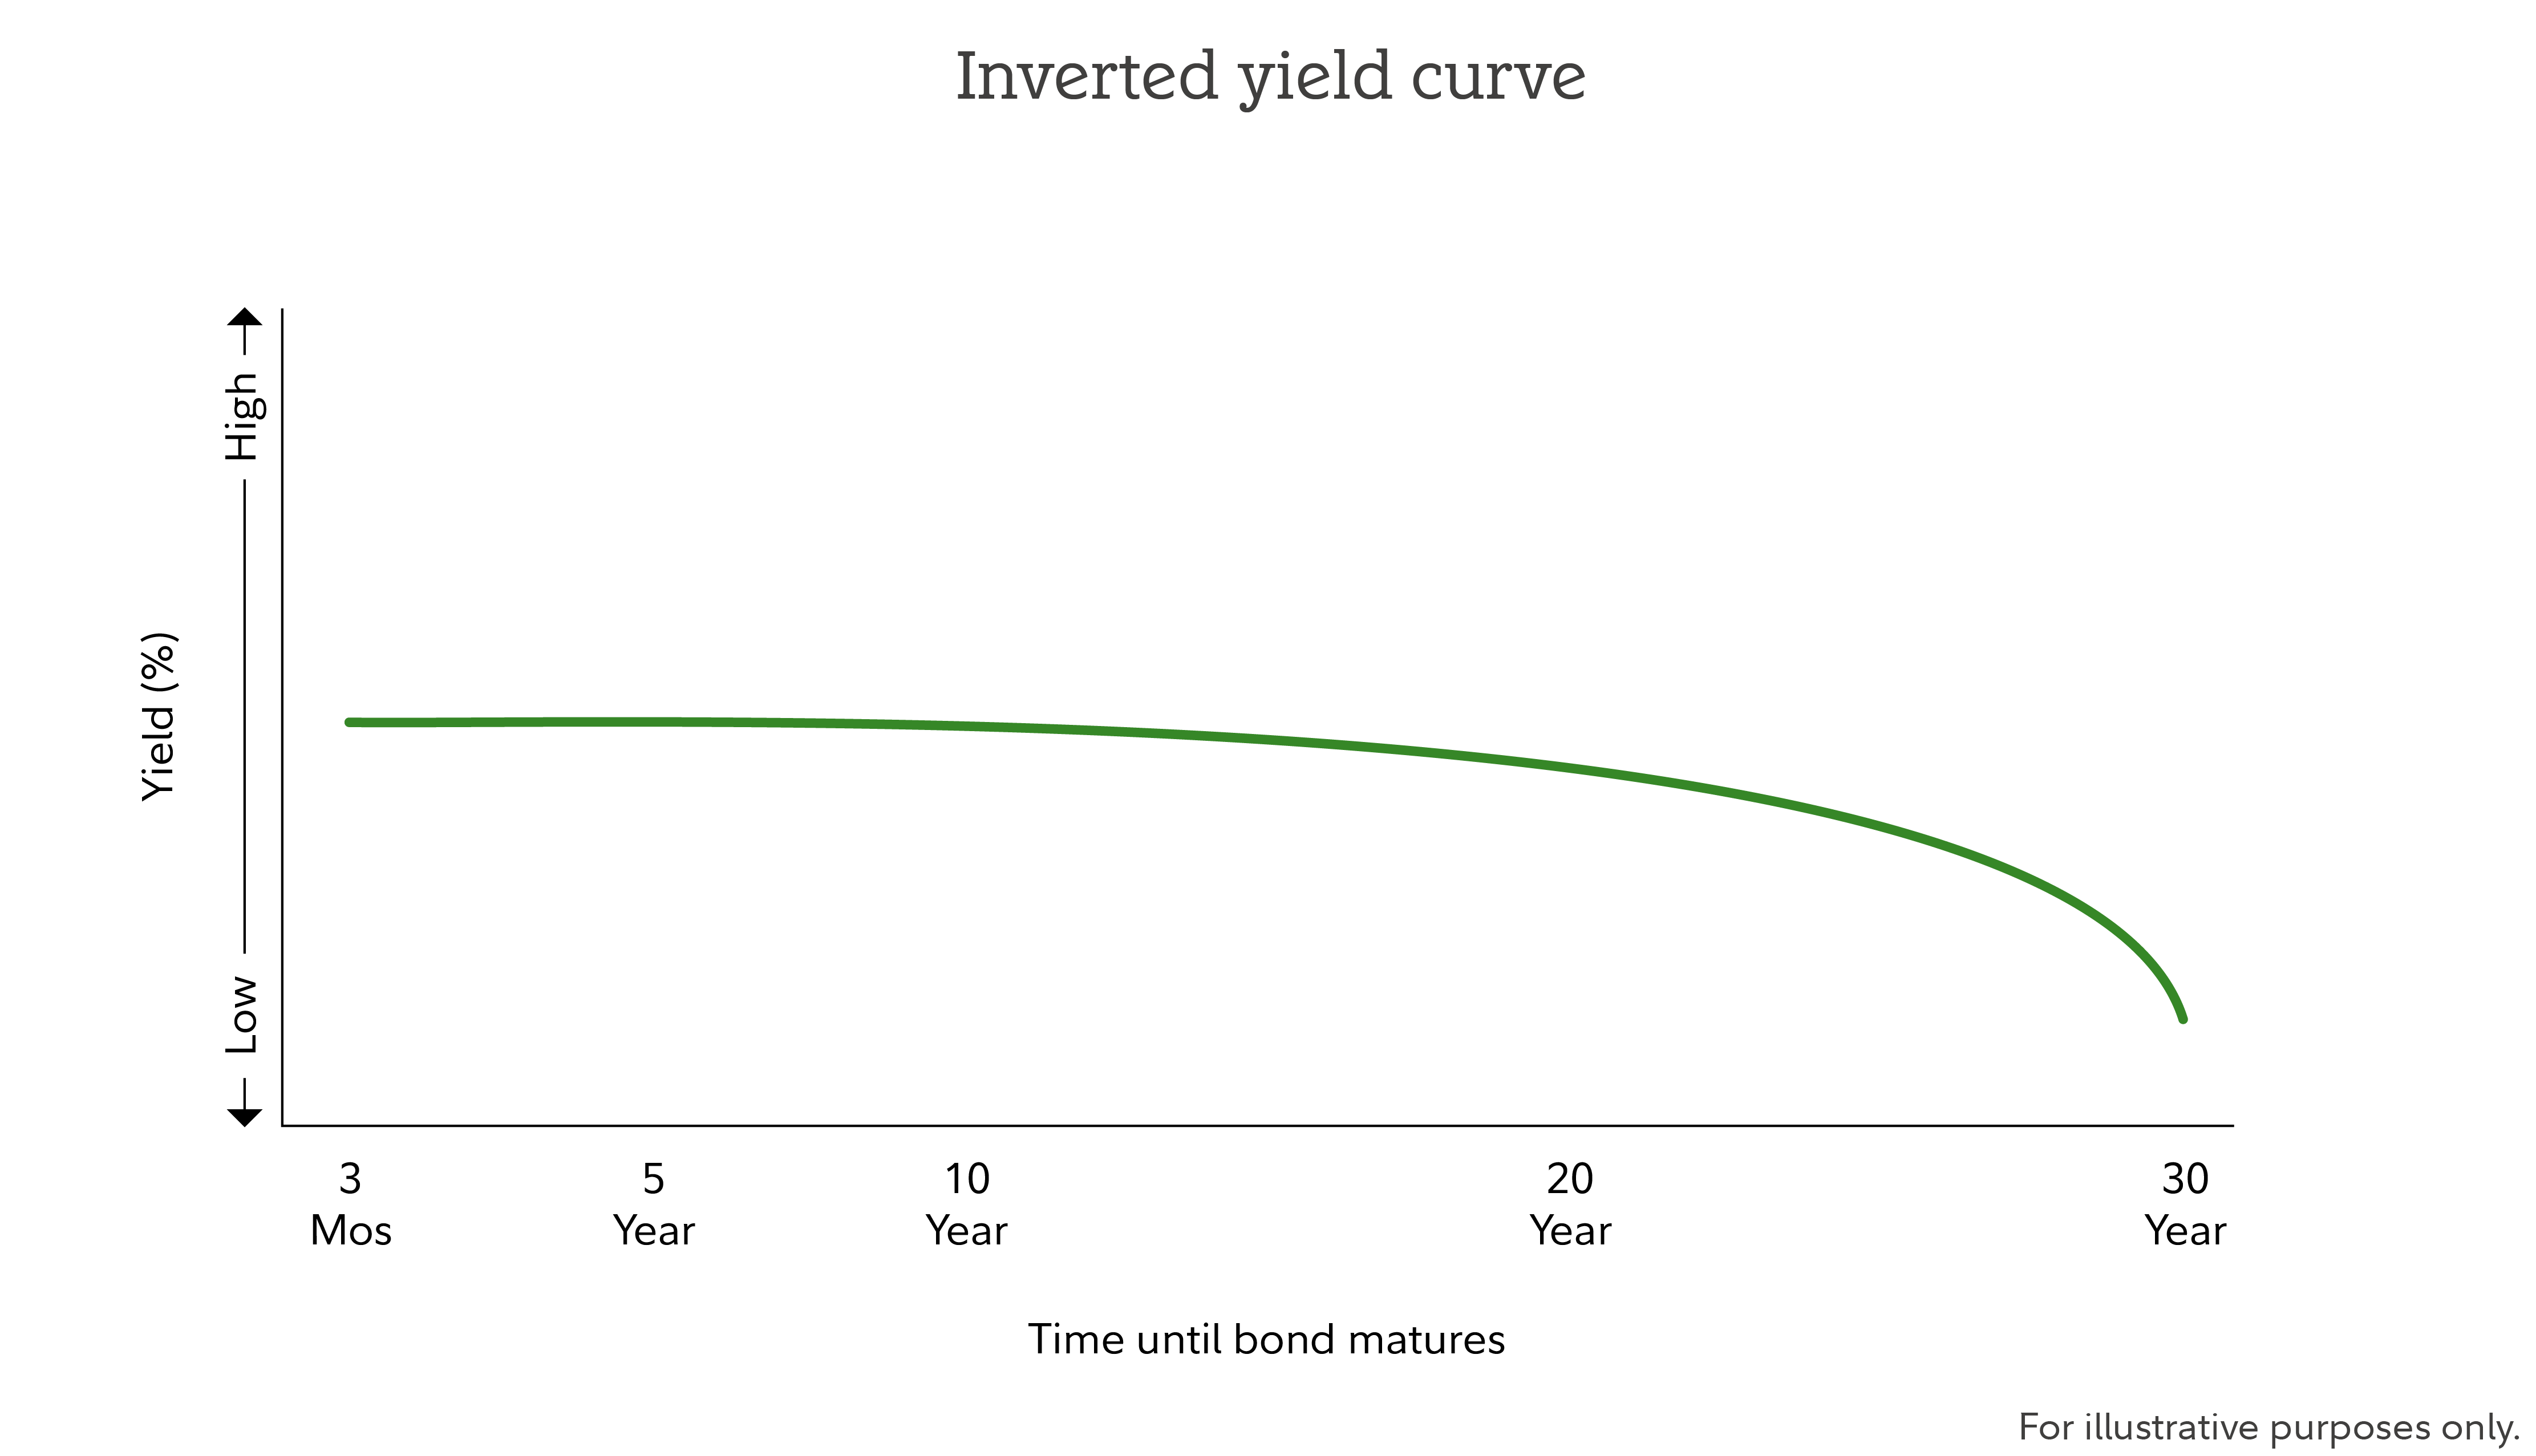
An inverted yield curve is when short-term Treasurys offer higher yields to maturity than longer-term bonds (most commonly tracked via the 10-year minus 2-year or 10-year minus 3-month Treasury yield spread). When this occurs, investors receive a higher annualized yield or rate of return for shorter holding periods than for locking in capital for a decade or more.
How does an inverted yield curve work?
An inverted yield curve is the result of short-term bonds, which mature in under 3 years, earning higher annual returns than longer-term bonds. When this happens, you’re poised to potentially earn a greater yield from bonds that mature sooner rather than later. While an inverted yield curve may make earnings on short-term bonds seem higher (and they might be in the short term), buying short-term bonds exposes you to reinvestment risk. Translation: You may be able to earn 5% in the next year, but a year later, your bond may mature and you won’t necessarily be able to earn 5% on bonds anymore. With a longer-term bond, the fixed coupon yield is locked in for an extended horizon, mitigating investment risk if broader market interest rates decline.
What causes an inverted yield curve?
A few factors can influence yields falling on bonds with later maturity dates.
- Investor demand changes. If investors are clamoring to purchase long-term bonds, demand will rise. That makes bond prices increase. Bond prices and yields have an inverse relationship, so when prices rise, yields drop, inverting the normal curve.
- A pessimistic economic outlook. Why would investors show a heightened interest in long-term bonds over short-term ones? One answer may be safety. If investors are worried about impending economic weaknesses, like a recession, they may be drawn to bonds with a longer time horizon—as opposed to stocks or short-term bonds. Again, higher demand for long-term bonds lifts their prices but pushes down yields. Lower long-term rates can also mean that investors expect the Federal Reserve to cut the federal funds rate. That’s the interest rate banks and other financial institutions charge each other to borrow money, and it influences short-term interest rates. The Fed often cuts this rate to counteract a weak economy.
- Rising interest rates. The Federal Reserve may raise the federal funds rate to help combat inflation, which could lead to higher short-term interest rates. When short-term rates go up but long-term rates don’t or not by as much, the yield curve may invert.
Why is an inverted yield curve important?
An inverted yield curve is important because of what it might signal.
- It could indicate a recession is coming. Economists and investors pay close attention when an inverted yield curve arrives because it has historically preceded a recession. This isn’t an exact science, and no single inverted yield curve can definitively predict future economic outcomes, but one has occurred before every US recession since 1955. Note, however, that recessions do not happen overnight; historically, an economic downturn lags the initial inversion. While the curve inverted in 2022, robust growth and consumer spending delayed or averted a traditional downturn.
- It can reveal how investors view interest rates. If investors believe that now is the best time to lock in interest rates before they potentially fall, it increases demand for long-term bonds, making yields fall. If short-term rates don’t also fall, or not by as much, it can prompt an inverted yield curve.
Historical examples of inverted yield curves
Inverted yield curves are not crystal balls, but they have historically preceded economic downturns within the next 2 years. Below are a few notable examples from Federal Reserve data.
- 1957: In the fall, the yield curve inverted, coinciding with the start of a recession that lasted through the spring of 1958.1
- 1978: The inversion kept going through the first half of a recession that hit in early 1980. The yield curve turned around toward the end of that recession only to invert again in late 1980. There was another recession in 1981.2
- 1989: Another inverted yield curve preceded a recession in 1990.3
- 2000: Early in the year, an inverted yield curve arrived and stuck around. The US economy entered a recession about a year later.4
- 2006: An inverted yield curve preceded the Great Recession, which began in 2007.5
- 2019: A brief inverted yield curve occurred that summer. Although the US did enter a short recession the following winter, there was also the COVID-19 pandemic that rocked major markets worldwide.6
- 2022: The yield curve that entered inverted territory that year persisted for more than 2 years. As of October 2026, the US still has not entered a recession.7
What do inverted yield curves mean for investors?
Inverted yield curves mean that short-term bonds may offer higher initial yields than long-term bonds. Still, long-term bonds can deliver substantial total returns if interest rates fall as bond prices rise and longer-duration securities experience greater capital appreciation. Beyond deciding which bonds to buy or sell, inverted yield curves may warrant taking these other actions.
- Review your portfolio. Look into whether any of your holdings might suffer when short-term yields are higher than long-term ones. For instance, lenders may profit less in this environment if they charge borrowers long-term interest rates but pay short-term rates on the money they borrow.
- Consider investments that tend to remain stable in recessions. Even though a yield curve inversion doesn’t guarantee a recession, you may want to think about investments that have done well in downturns. These could include stocks tied to necessities, such as those in the consumer staples, health care, and utilities sectors. Just remember past performance doesn’t guarantee future results.
- Prepare for the possibility of increased market volatility. But don’t let panic dictate important financial decisions. Stick to your financial plan if you have one—a strong plan is built for moments like this. If you’re concerned, speak to a financial professional who can help you plan accordingly.