


With the AI investment boom driving corporate profits higher, US stocks have climbed to a series of record highs this year. For many investors, that success can feel unsettling. After all, markets don't go up forever.
Markets recently have leveled off. Investors since early June have been reassessing the elevated valuations of the S&P 500 Index, the greater likelihood for Federal Reserve rate hikes, ongoing geopolitical risks, and concerns that the market has become dependent on a handful of technology companies.
Still, several indicators suggest the current bull market may have more room to run.
Earnings growth is strong and expected to accelerate. Consumers, while anxious, are still spending and fueling the economy. Stock price valuations, though elevated, are below the levels reached in past market booms.
Most notably, investor sentiment remains cautious even as markets surge, with Americans mindful of heightened geopolitical tensions, the potential for continued inflation, and higher gasoline prices. That caution, though, may be an encouraging sign because bull markets more often come to an end when investors are exuberant rather than fearful.
"The enemy of stock investing is euphoria," says Denise Chisholm, director of quantitative market strategy at Fidelity. "The more we're focused on all the bad news, the higher the odds the market can keep climbing."
While a number of risks remain, including the possibility of slower earnings growth, a weaker labor market, or unexpected policy shocks, the current backdrop continues to feel supportive of stocks reaching new all-time highs.
Can the stock market keep reaching all-time highs? 5 signs to watch
Here are 5 factors investors may want to consider as they assess this market:
1. Rising profits have supported higher stock prices
The stock market's advance has been powered by robust corporate earnings as a host of companies invest heavily in AI infrastructure and technology.
In the March quarter, S&P 500 earnings rose 28% year over year, well above the long-term average growth rate. Even excluding technology companies, earnings increased 14%. Profit margins have also reached their highest levels since 2009.
As results arrive for the June quarter, expectations for future earnings growth remain positive. Analysts have been generally raising their estimates for 2026 profits, both for the S&P as a whole and for most sectors within the index, and expect profit growth to exceed 20% for the year.1
"It feels to me like this rally has been justified. Valuations have been higher than historic averages, but that's not necessarily a warning sign because the earnings outlook is also incredibly strong," says Naveen Malwal, an institutional portfolio manager with Strategic Advisers, LLC, an investment advisory unit of Fidelity.
“Historically, there has been a strong relationship between earnings growth and rising stock prices,” he continues. “If earnings continue to grow in the coming quarters, I believe stocks may continue to rally, even if bouts of volatility occur from time to time.”
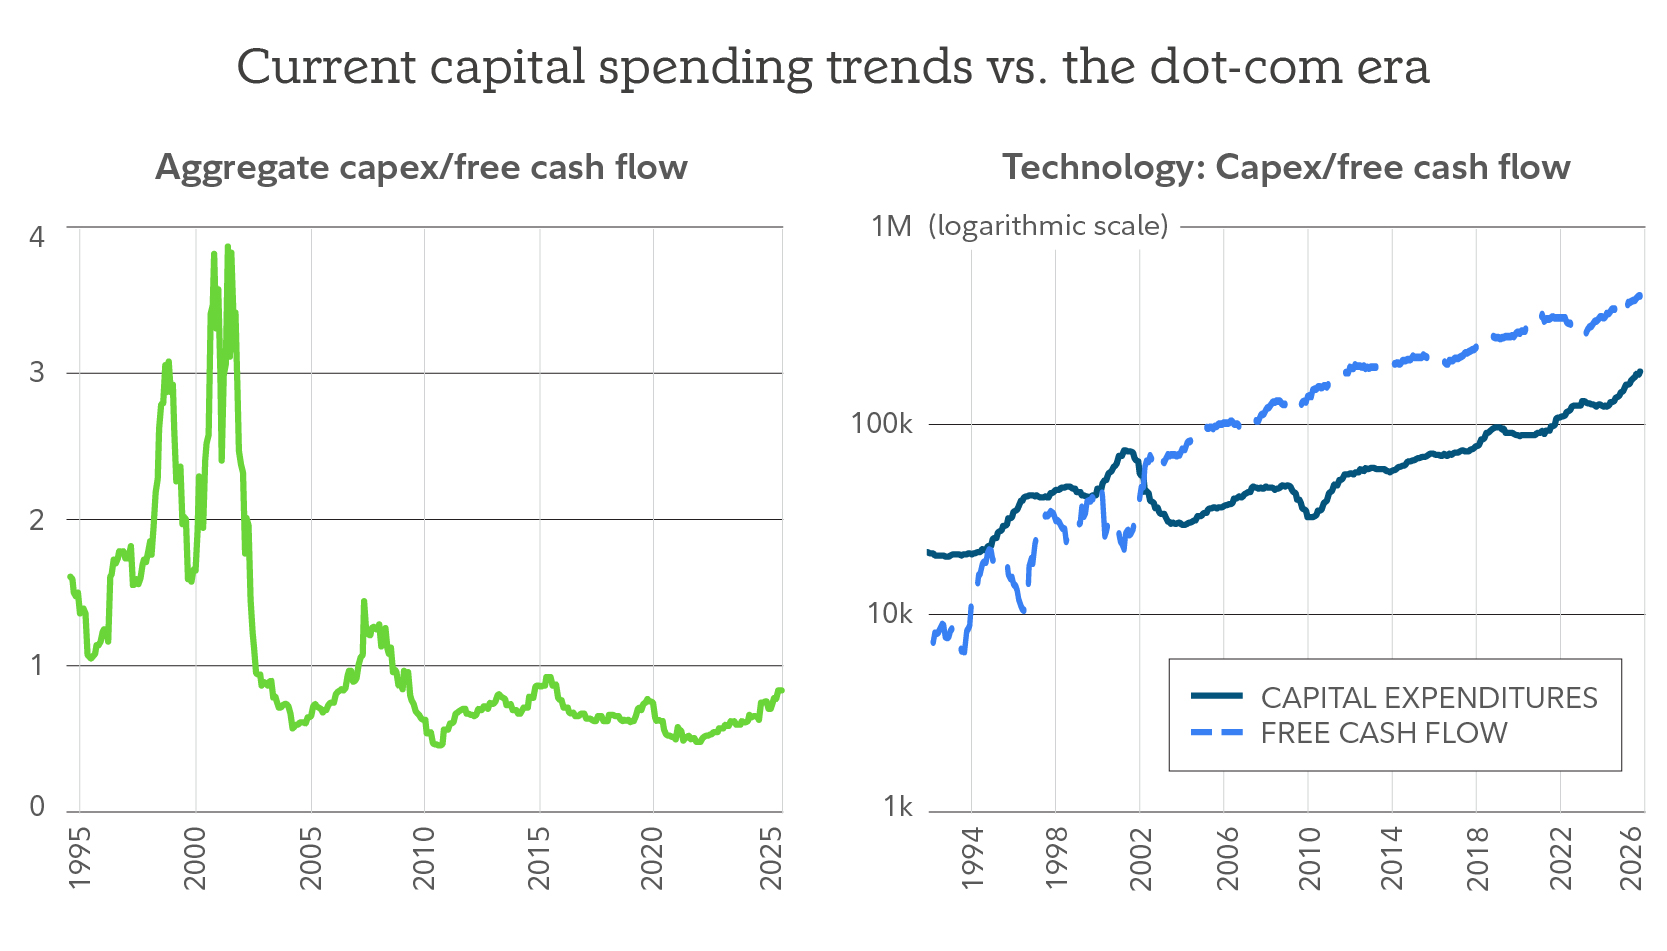
The AI spending cycle may also be more durable than some investors assume. Unlike the dot-com era, when companies were spending more than they were generating in free cash flow, capital expenditures among US technology companies remain relatively low as a percentage of free cash flow.
This suggests companies have been funding investments from a position of financial strength rather than speculation.
2. Valuations don't look like a classic bubble
Comparisons to the market’s dot-com era are common whenever technology stocks lead the market to new heights. Today's backdrop looks different.
The S&P 500 Index trades at roughly 20 times projected 2026 earnings, while the equal-weighted S&P 500 trades around 18 times earnings. By comparison, at the peak of the late dot-com era, the largest technology firms in the S&P 500 traded at more than 125 times their estimated earnings. Even valuations on the shares of the mega-cap “Magnificent 7” technology leaders appear reasonable given the group’s substantial earnings growth.
"For now, earnings have been growing so strongly that it's hard to call this a bubble," says Jurrien Timmer, director of global macro at Fidelity. "Bubbles have been about excessive valuations and a lack of earnings growth. So far, we don't have either, which is why I’m not yet alarmed."
That doesn't mean stocks have been cheap, but by historical standards, current valuations appear more grounded in fundamentals.
3. The earnings cycle may be younger than many realize
Despite years of strong market performance, Chisholm argues that the broader corporate earnings cycle may still be at a relatively early stage. While index-level profits have surged in recent years, much of that growth has been concentrated among a relatively small group of large companies.
Median corporate earnings remain below the previous peak reached in 2018, suggesting many companies have been working through a longer recovery period following the pandemic and its economic disruptions.
"It's been 7 years, and we really haven't gone anywhere in terms of earnings growth on a median basis," Chisholm says.
Historically, earnings cycles that take longer to recover have often lasted longer once new highs are reached. If that pattern holds, this bull market could potentially endure.
"Once you get back to prior market peaks, the cycle on average has lasted another 4 years," Chisholm says.
4. Consumers continue to drive the economy
Consumer spending accounts for roughly 70% of US economic activity, making household finances an important indicator for investors.
Although many Americans remain frustrated by higher prices and the cumulative effects of inflation, spending has remained resilient thanks to a relatively stable job market. The result is an economy that has continued to expand despite broad, persistent pessimism.
"The US is in the middle of an ongoing expansion, which can last for some time," Malwal says. "It's a good economy that doesn't feel good. And though consumers have struggled with rising prices, their spending growth continues to rise. This may support further US economic growth."
If consumers remain employed and continue spending, the broader economic expansion could help support earnings growth across a wide range of industries.
5. Investors remain skeptical even as they spend
Many investors remain uneasy about stocks, even after years of gains.
Concerns about inflation, geopolitical tensions, energy prices, tariffs, and the possibility of a market pullback continue to weigh on sentiment. Yet from a market perspective, lingering skepticism may actually be constructive.
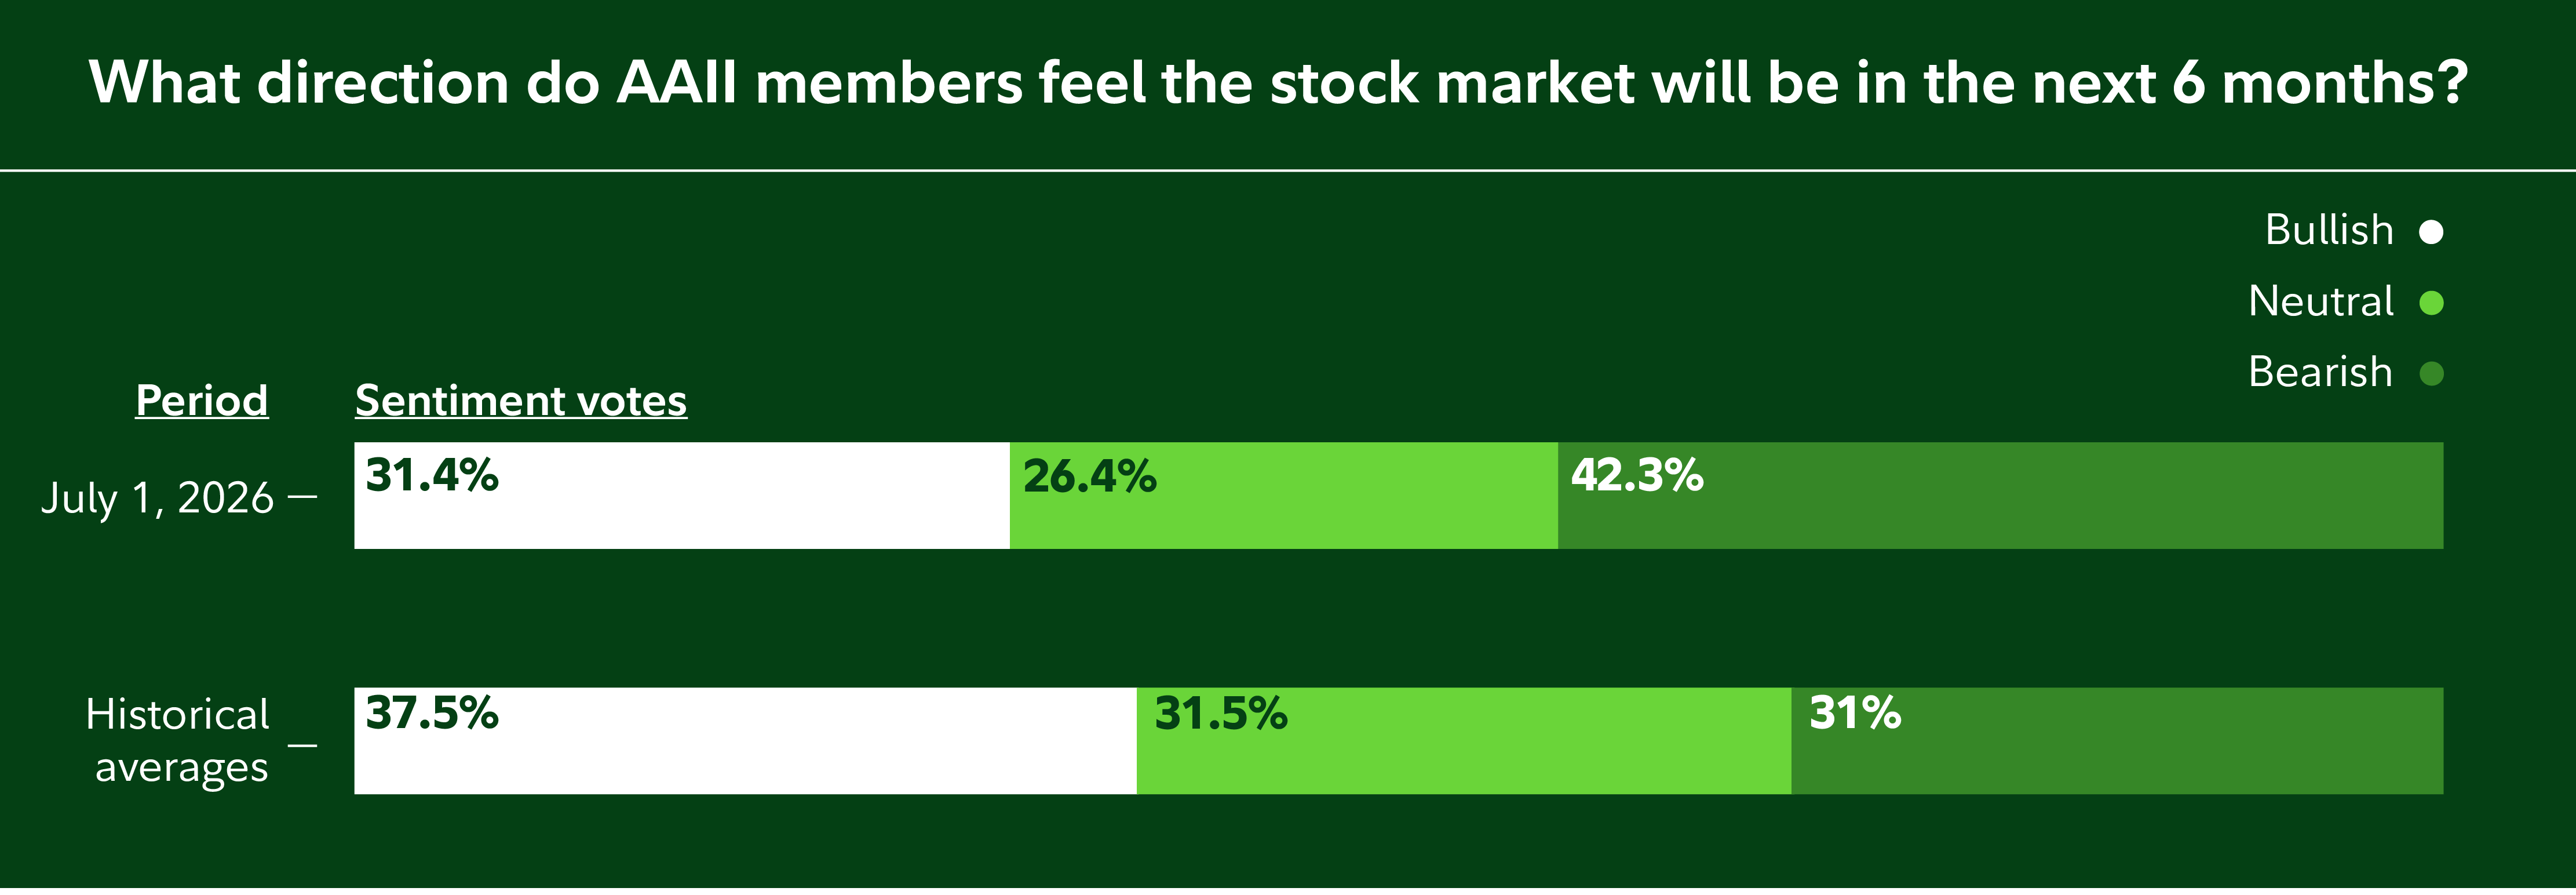
Bull markets often become most vulnerable when investors grow complacent and assume prices can only move higher. Today's environment appears different.
"Persistent skepticism may be evidence that optimism has not reached dangerous levels," Chisholm says. “In fact, the market has historically performed better over the following 12 months after periods when investor sentiment has been at its worst. As long as investors remain focused on risks, the market may still have room to climb the wall of worry."
Portfolio moves to consider as stocks reach all-time highs
Strong markets can make investors nervous, but making dramatic portfolio changes based on fear can be costly.
Rather than making all-or-nothing decisions, investors may want to use market strength as an opportunity to review their asset allocation, rebalance portfolios, and ensure they remain appropriately diversified. Opportunities for rebalancing and managing risk could include increasing exposure to bonds, adding international stocks, or reducing concentration in the largest technology names.
"When the market does very well, some investors get nervous. It's a good, healthy instinct, but rather than reacting emotionally, use that concern as a prompt to do more research,” says Malwal. "Historically, the market has always recovered from bouts of volatility and has gone on to eventually make new all-time highs. While past performance is no guarantee of future outcomes, I believe investors who are patient and disciplined are more likely to experience more growth over time."
In other words, record highs aren't of themselves a reason to be afraid. Strong earnings, a growing economy, reasonable valuations, and a healthy dose of investor caution suggest this bull market may still have room to run.