Time & Sales
-
How do I access Time & Sales in Fidelity Trader+™ Desktop?
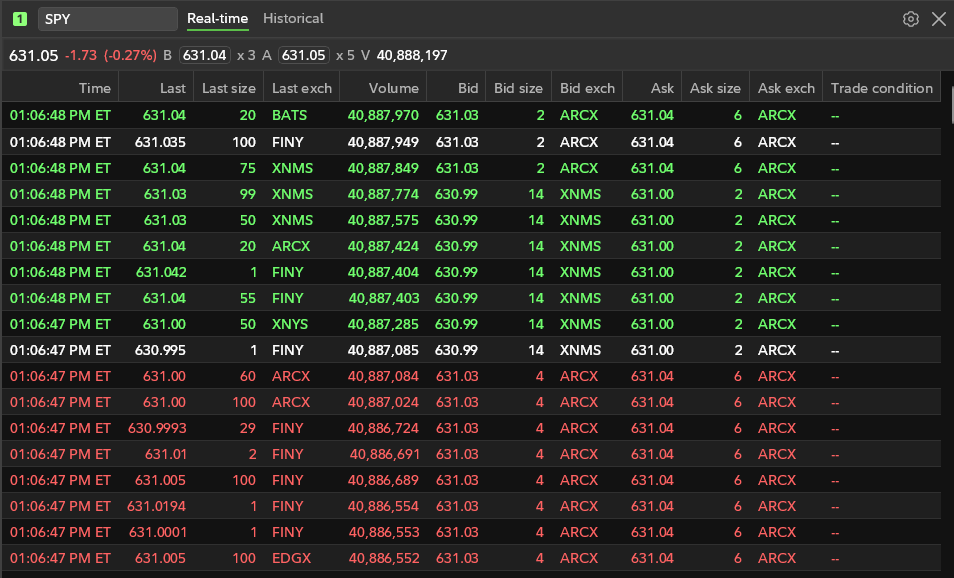
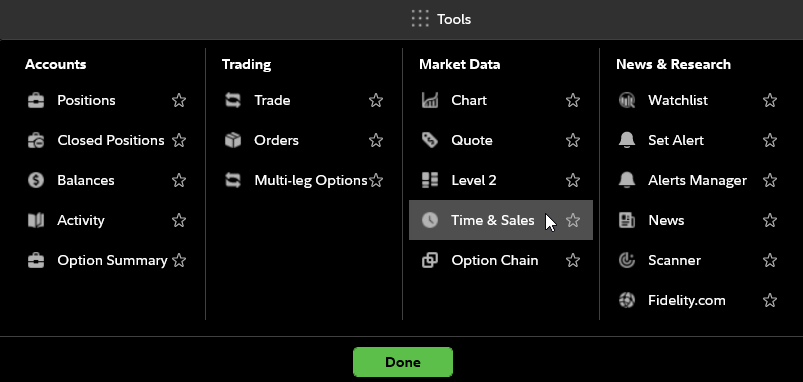
In the Tools menu, under Market Data, select Time & Sales. In Fidelity Trader+™ Desktop, this will open a Time & Sales window. Move and resize the chart within your layout as needed. Enter the symbol of the stock or ETF you wish to research further. The Time & Sales tool provides you both a streaming and historical view of individual trades in the market.
-
What do Time & Sales colors mean in Fidelity Trader+™ Desktop?
The Time & Sales tools provide 3 different colors to quicky distinguish trade executions. Green highlights the trades in which the last trade occurred at the Ask price or higher. Red highlights the trades in which the last trade occurred at the bid or lower. White or no shading indicates the last trade price occurred between the bid and ask.