


For decades, buying an individual bond often felt a bit like navigating a marketplace in a foreign country. Investors couldn’t be sure where a quoted price came from—or whether it was inflated—and often had to accept that they were paying more than the locals.
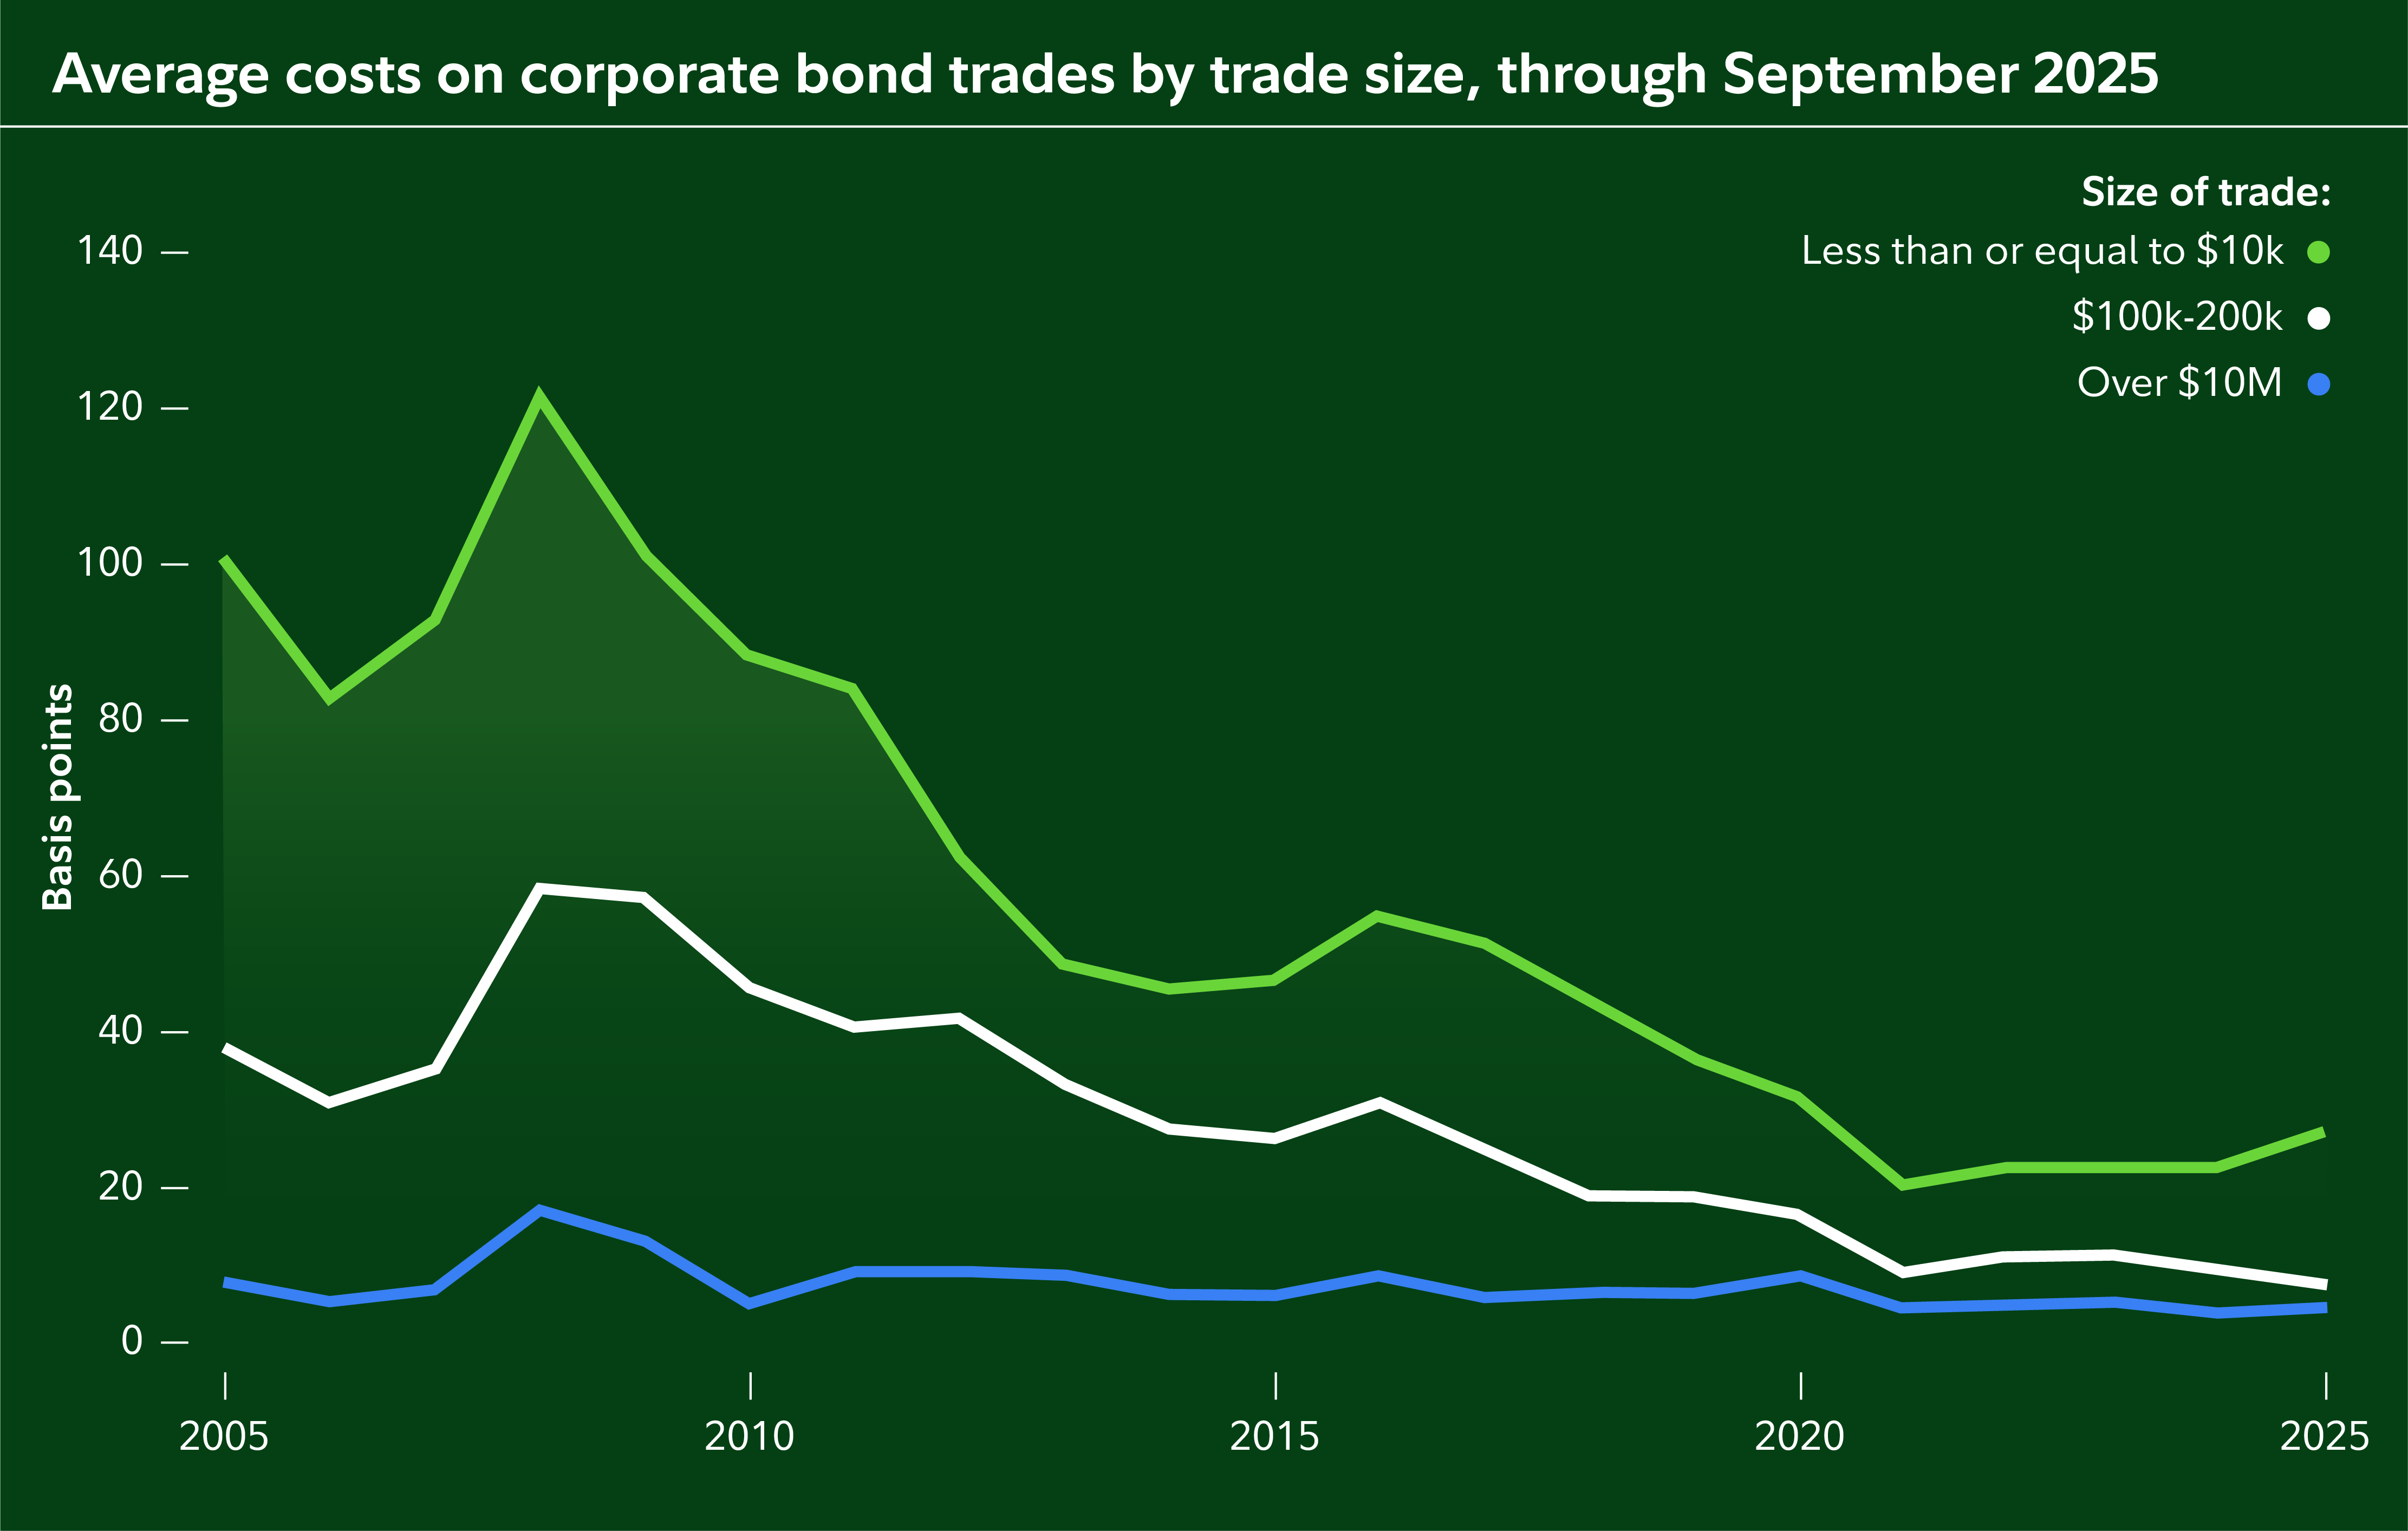
But over the past 20 years, that’s gradually been changing. Thanks to an evolution behind the scenes, transaction costs have been coming down dramatically, particularly for ordinary investors. Recent analysis by Fidelity found that corporate bond transaction costs declined by almost 80% between 2005 and 2025, based on transactions of $10,000 or less.1
Still, while the overall backdrop of the bond marketplace has become much more favorable to the little guy in general, it remains important to be aware of what you’re paying—and to understand the difference where you shop can make.
A more level playing field for bond investors
The corporate bond market operates as an “over-the-counter” market, with dealers communicating one-on-one about prices and trades. Larger trade sizes have historically received better pricing. So it was long accepted that individual investors must accept higher transaction costs to compensate for their smaller trade sizes.
Yet over time, market changes have helped to dramatically close that gap. The system for gathering quotes from dealers has gotten faster and more competitive. Data on bond market transactions, like the price and size of a trade, is now typically publicly reported very quickly. And due to regulatory changes, the exact markup an individual investor paid is now often disclosed on their trade confirmation—further boosting transparency and competition.
Today, there’s less of a difference between the price an ordinary investor sees quoted on their broker’s website and the price paid by a professional investor who might be transacting in much larger sums.
Gains for bond investors have been uneven
Even as the overall market has become more competitive, pricing differences have persisted.
The bond market is highly heterogeneous and fragmented, which makes it challenging for investors to comparison shop. Many brokers bake markups and transaction fees into the prices they quote online, making it difficult to know how large of a markup is embedded in a particular price. At Fidelity, the bond prices you see come directly from dealers and other market participants who want to buy and sell with us.2 If you buy a bond, we add a transparent $1 markup per bond at the time of the trade.
One way to observe those differences is to compare prices quoted for the same bond across different brokerage platforms. In practice, that isn’t always straightforward. The bond market is vast and highly varied, meaning each firm may offer a slightly different selection of bonds at any given time.
But when there is overlap, the discrepancy can be meaningful. A 2026 pricing study comparing online bond offerings across several major brokerage firms found that Fidelity’s prices were lower more than 96% of the time across a large sample of corporate and municipal bonds. On average, the difference amounted to $13.78 per bond—or more than 1% of the principal value of each bond.3
How much additional yield can a $13 per bond price saving work out to?
Take as an example, a 5-year, AA-rated, corporate bond recently found in the Fidelity inventory.

At the dealer’s price of $997.31 (as shown in the circled column in the screenshot above), the bond’s yield would work out to about 4.94%. Including Fidelity’s $1 per bond transaction cost would bring an investor’s yield to 4.91%.
However, if the investor instead paid a $14 markup (or $13 more than Fidelity’s transaction cost), it would reduce their yield even further, to about 4.62%.
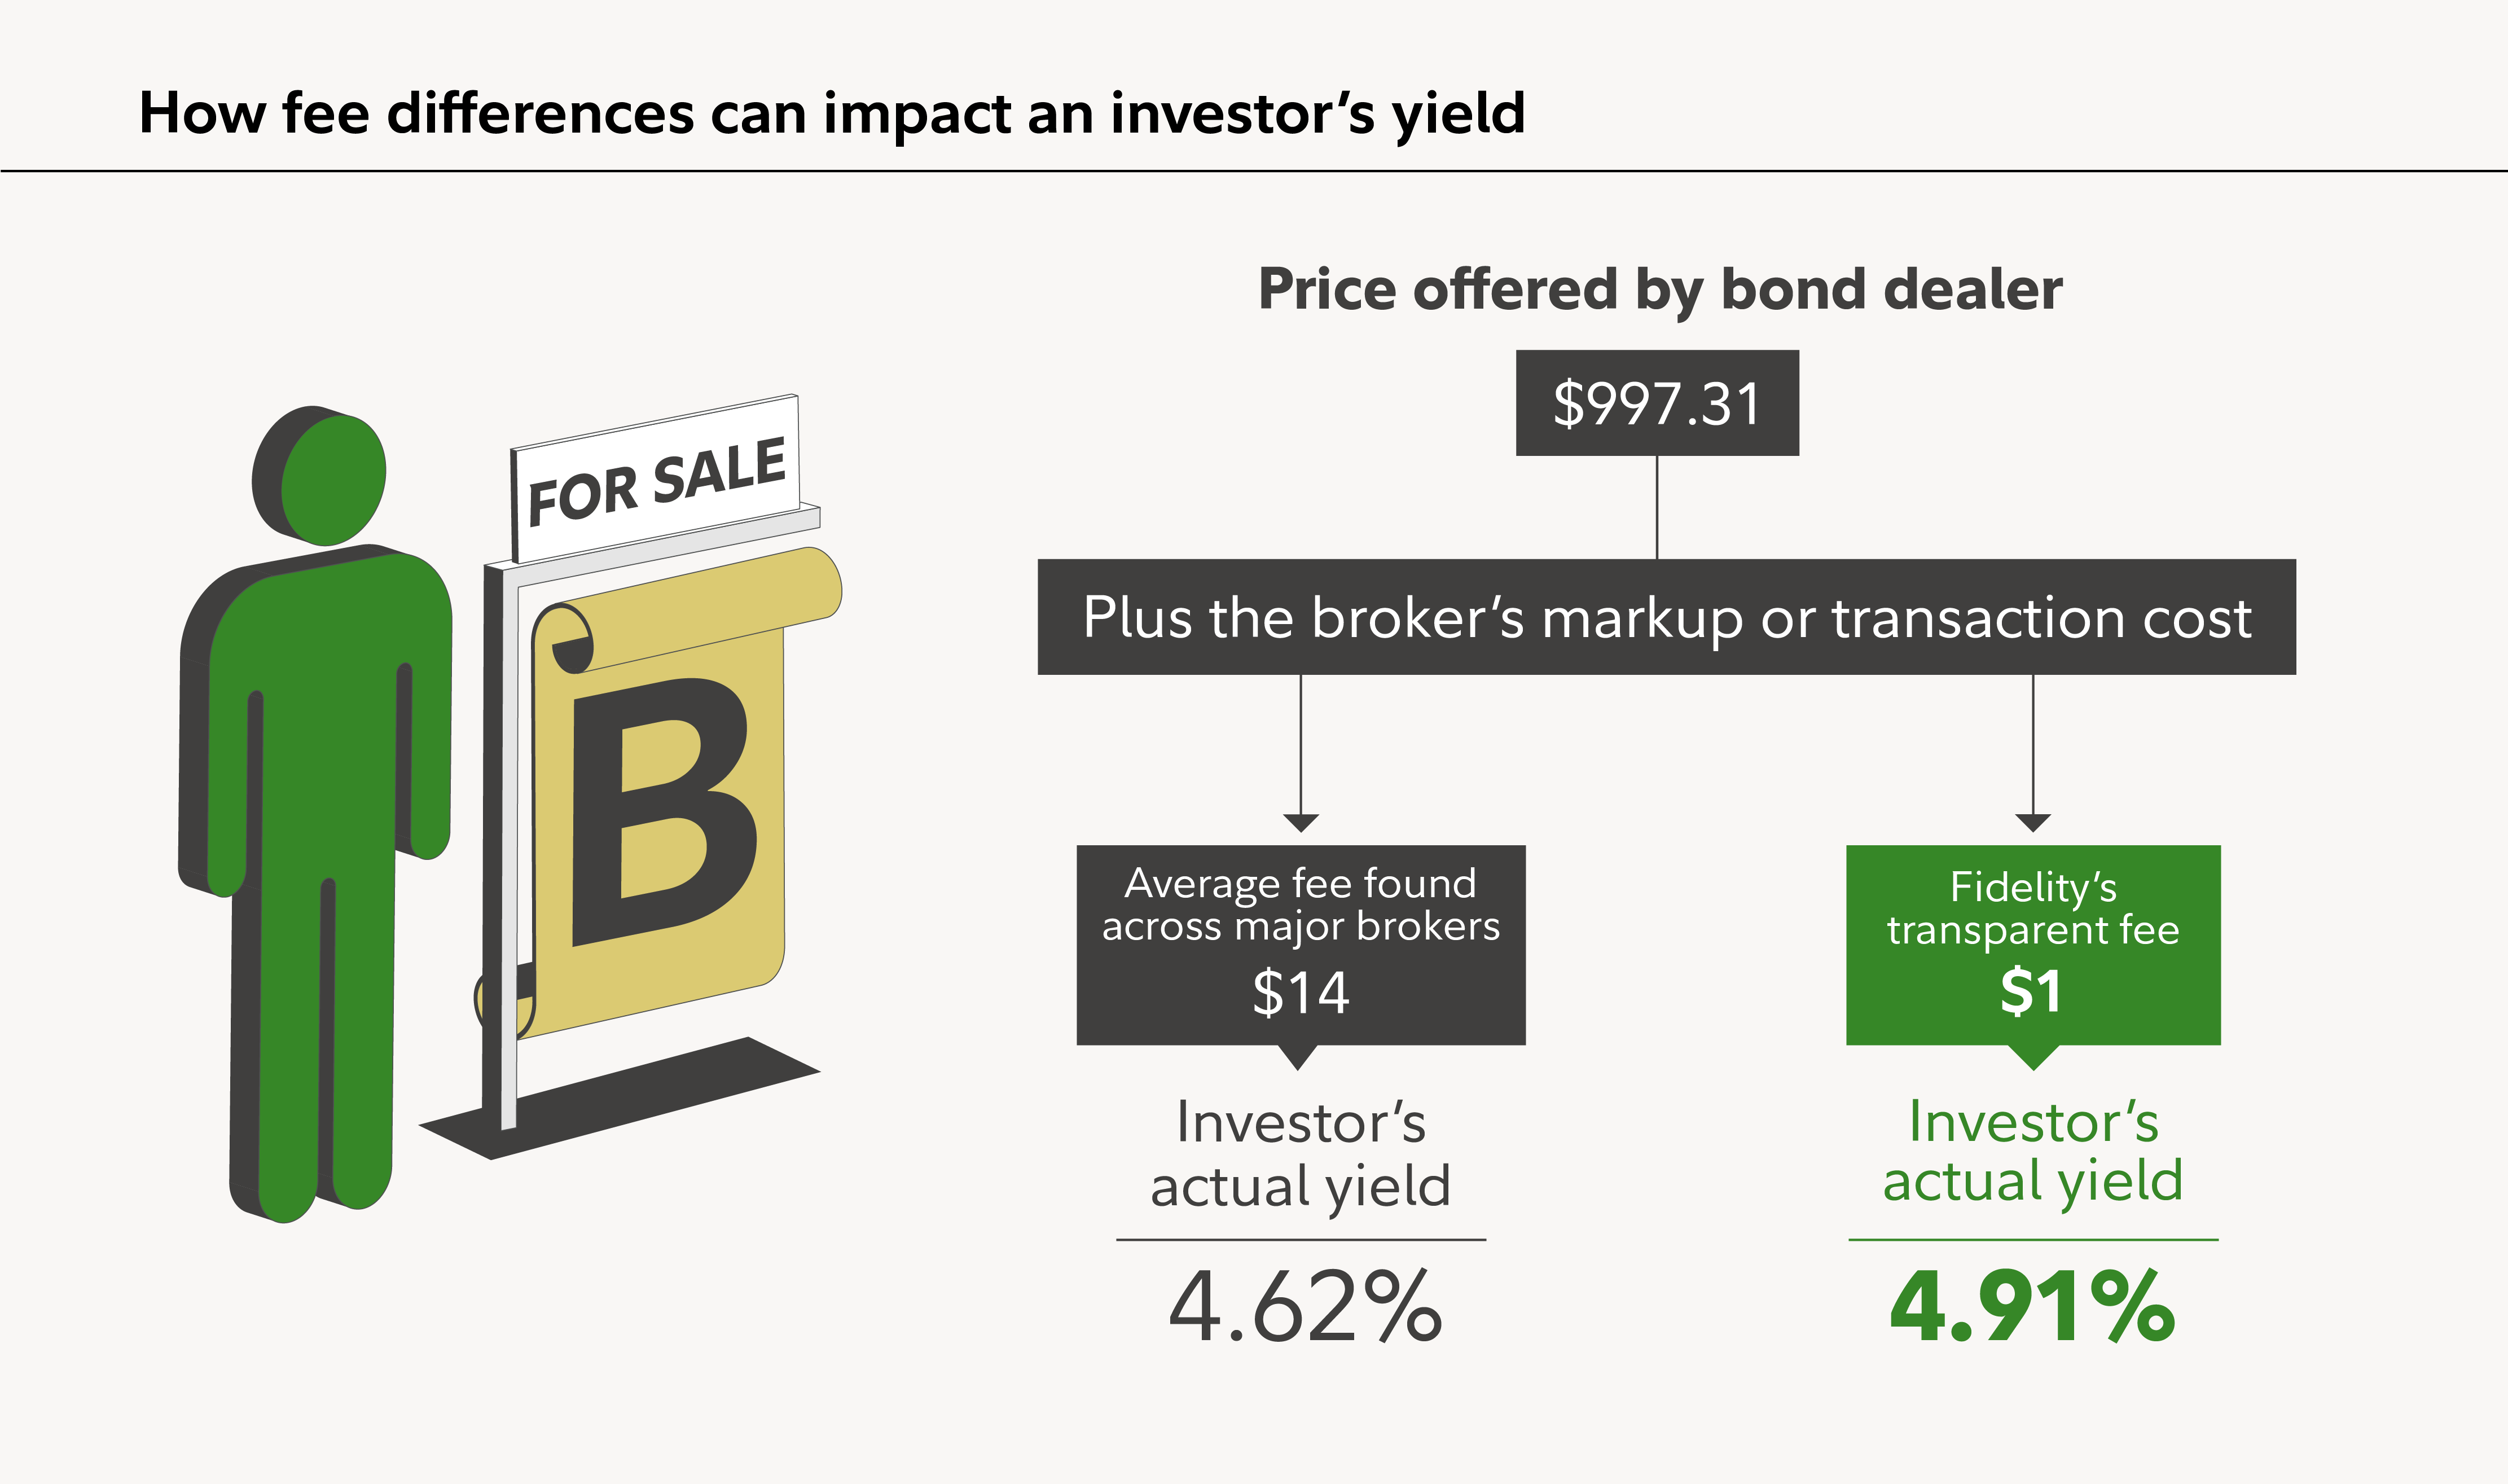
In this hypothetical example, the investor could gain almost an additional 30 basis points in annualized yield over the bond’s remaining 5-year term by paying lower transaction costs for the same bond (a basis point is 0.01 of a percentage point).
Another way to compare these differences is to look at the actual prices investors paid, by considering transaction data that’s publicly reported after a trade. In Fidelity’s study of corporate bond transactions, investors across all brokers generally paid actual transaction costs of 14 to 30 basis points, depending on the size of the transaction, from 2022 to 2025.4 In the same period, Fidelity customers paid actual transaction costs of 7 to 13 basis points, or about 50% to 56% less than typical costs in the market.
How to learn what you're paying
Comparing bond prices at different brokers is trickier than comparing the price of a refrigerator at 2 different stores, but it can be done. If you have accounts with different brokerage firms, you can first verify whether their transaction costs are transparent, or whether markups and fees are baked into the bond prices displayed online.
Next, log on and check whether they offer the same bond. If they do, then compare the prices. This won't always work, however, because the large and heterogeneous nature of the bond market means 2 brokers are likely to offer different selections of bonds at any given point in time.
Another option is to review trade reporting data provided by the Municipal Securities Rulemaking Board (MSRB) and Trade Reporting and Compliance Engine (TRACE).
| How Fidelity can help |
Here’s how to compare bond prices on Fidelity.com's bond offering Yield Table:
Or, if you are researching a particular security:
Both methods will take you to recent trades, which can be viewed as a table or as a chart. |
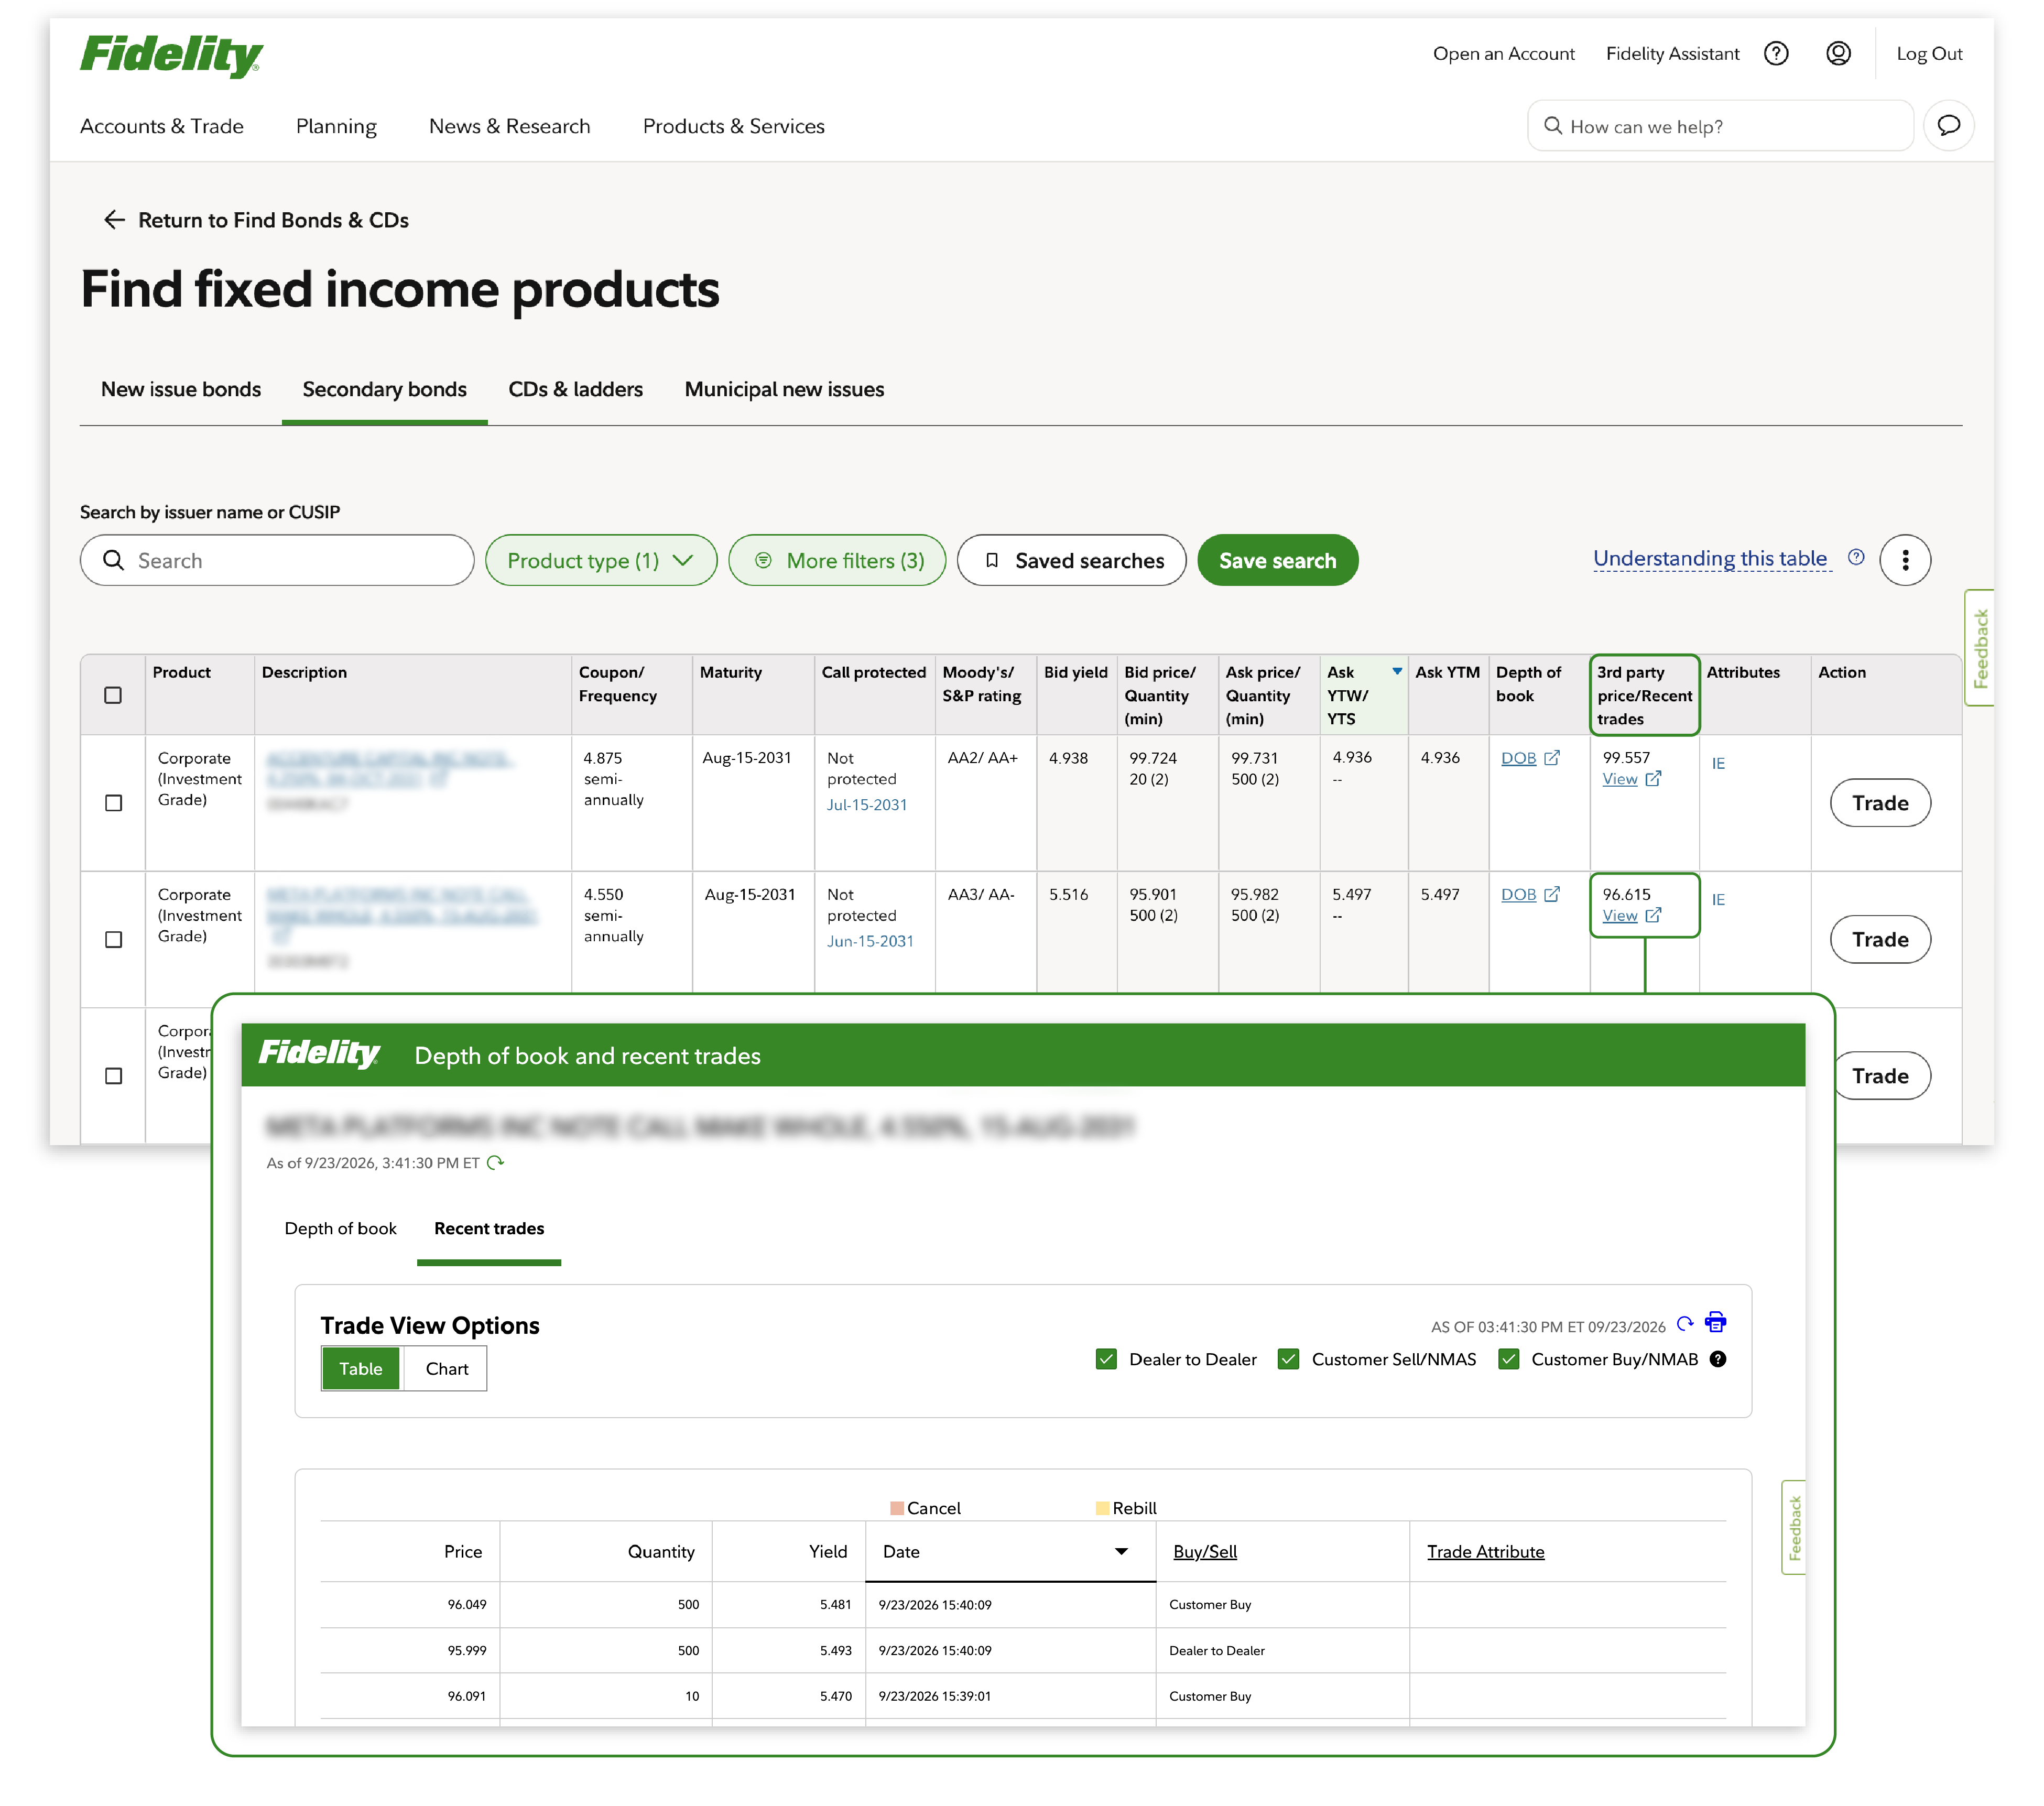
Prices and yields change from day to day. By using the historical trade data from MSRB and TRACE, you can see where prices and levels have been trading in the recent past and compare them to the current live offer or bid prices. In addition, by comparing customer prices with dealer-to-dealer prices for trades executed for the same quantities at the same time, MSRB and TRACE data provides increased transparency into the mark-ups that bond brokers are charging their clients. (Learn more about reading the tape for bonds.)
The importance of smart shopping
While some of the pricing differences may sound modest, they can be outsized given the role bonds typically play in a portfolio. Because bond returns are largely driven by the yield you lock in upfront, even small differences in purchase price can translate directly into a higher or lower total return over the life of the investment. Particularly for investors who maintain large allocations to bonds or who depend on bonds for steady income, such as in retirement, differences that might seem small at purchase can really add up over the life of a portfolio.
Moreover, costs are one of the few things a bond investor can control. No one can control whether interest rates go up or down, or where inflation may be in 5 to 10 years. But every dollar spent in costs is one less dollar an investor can put to work toward compounding—which is one reason why savvy investors tend to be highly cost-conscious.
Finally, when it comes to bond investing, higher costs often do not translate into better service or selection. In addition to competitive costs, Fidelity offers more than 150,000 bonds, plus online analytical tools and bond market research—not to mention access to bond specialists who can help you make sure the bonds you choose are a good fit for your strategy.
The experience of buying bonds may continue to evolve. But for investors willing to pay attention to pricing, it has already become a more level playing field.