


Midterm elections have a well-earned reputation for making investors a little nervous, as the stock market has often experienced greater volatility and weaker returns during midterm years. Many investors, though, may be surprised to learn that stocks have almost always generated stronger returns in the following year.
Since 1938, the S&P 500® almost always—95% of the time—posted price gains in the 12 months following midterm elections. Similarly, stocks have generated average returns of roughly 5% during the second year of a presidential term, though that average masks a wide variation in returns from one election cycle to the next. On average, though, those returns have jumped to 14% in the following 12 months.
The pattern of election cycles and stock market performance has led some investors to wonder whether they need to anticipate outcomes at the polls. History suggests otherwise: Sluggish performance in midterm years has generally reflected higher policy uncertainty in the lead-up to an election, rather than investor preferences for one party or another.
"Vote in the booths, not in your portfolios," says Anu Gaggar, vice president, capital markets strategy at Fidelity. "You don't want to whipsaw your portfolios based on speculation of what might or might not happen in an election."
How might midterm elections impact the stock market?
As the old saying goes, markets don’t like uncertainty. Election years, with daily news cycles generating sweeping headlines about future policies, are rife with uncertainty. It follows that greater uncertainty about the future direction of government policy has driven increased market volatility.
Yet the real direction of the markets remains guided by the core fundamentals that investors should always track: corporate earnings, capital spending, and economic conditions.
"The overall level of political uncertainty can fuel volatility, yet the market's core drivers are things like earnings growth and leading indicators of economic growth," says Denise Chisholm, director of quantitative market strategy at Fidelity. "These fundamental factors make up the mosaic of the market, and they matter a lot more than the elections themselves."
To be sure, the data shows that stock market returns have ranged widely in the first 2 years of a presidential administration. Midterm election-year returns have ranged from drawdowns of 27% to gains of nearly 40%, underscoring that midterms themselves are typically not the primary driver of market returns.
“As an investor, I wouldn’t do anything in anticipation of the midterms, given the wide range of returns that have followed. Elections have been a supplementary driver, not the core driver of stock market performance,” says Chisholm. “Basically, anything can happen.”
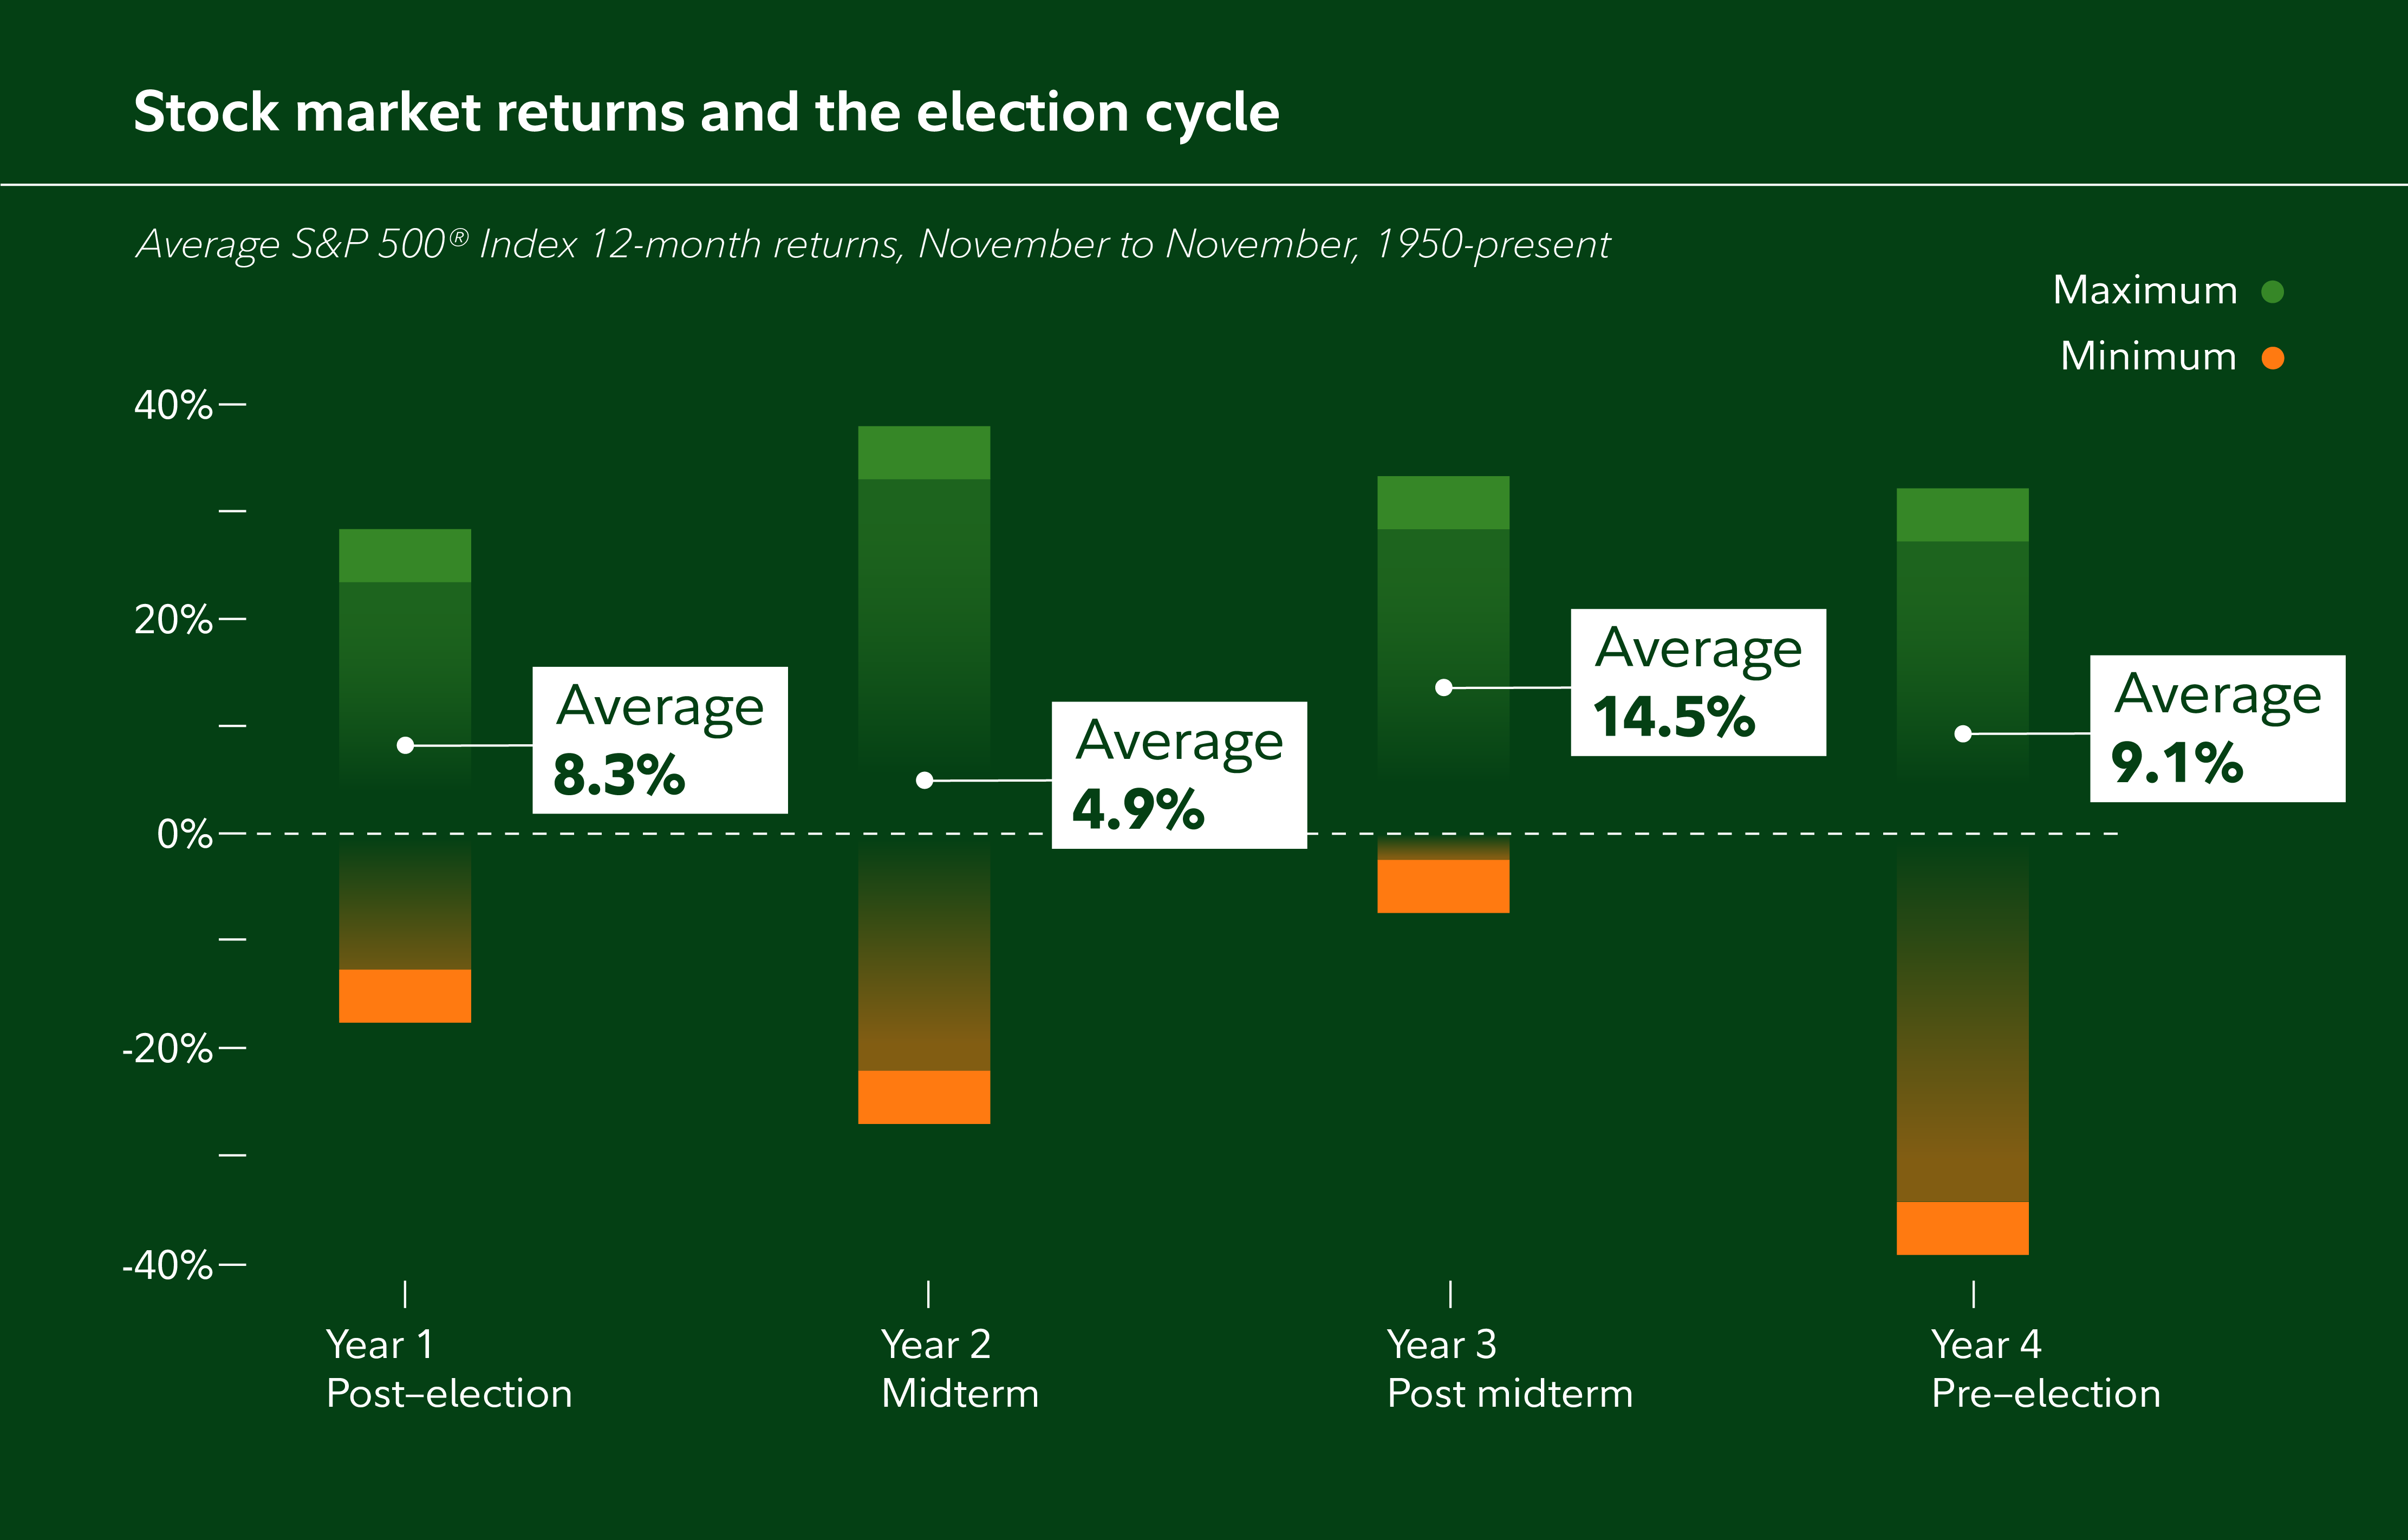
Source: Haver Analytics and Fidelity Investments.
Past performance is no guarantee of future results.
How have midterm elections impacted the stock market historically?
There is a well-documented relationship between stock market returns and the presidential election cycle. Since 1950, the second year of a presidential term has produced the lowest average returns and the weakest odds of market gains.
By contrast, the year following midterm elections has delivered the highest average returns and strongest odds of market gains. Importantly, this historical trend has not been tied to any one political party winning or losing power.
Does the stock market usually go up after midterms?
Stocks have usually risen in the 12 months after an election, but not always.
The more compelling explanation for midterm-year underperformance stems from uncertainty. The lack of clarity around taxes, regulation, spending priorities, and other policy issues typically increases ahead of midterm elections. Investors are forced to evaluate a wide range of possible outcomes while campaigns generate a steady flow of competing proposals and predictions.
Once voters cast their ballots, however, many of those unknowns begin to fade.
"Markets don't necessarily respond to voting results. However, they have tended to respond to improvement in economic policy clarity," says Chisholm. “Things rarely get to 'clear.' They just get to ‘less unclear,’ and that is usually enough for investors.”
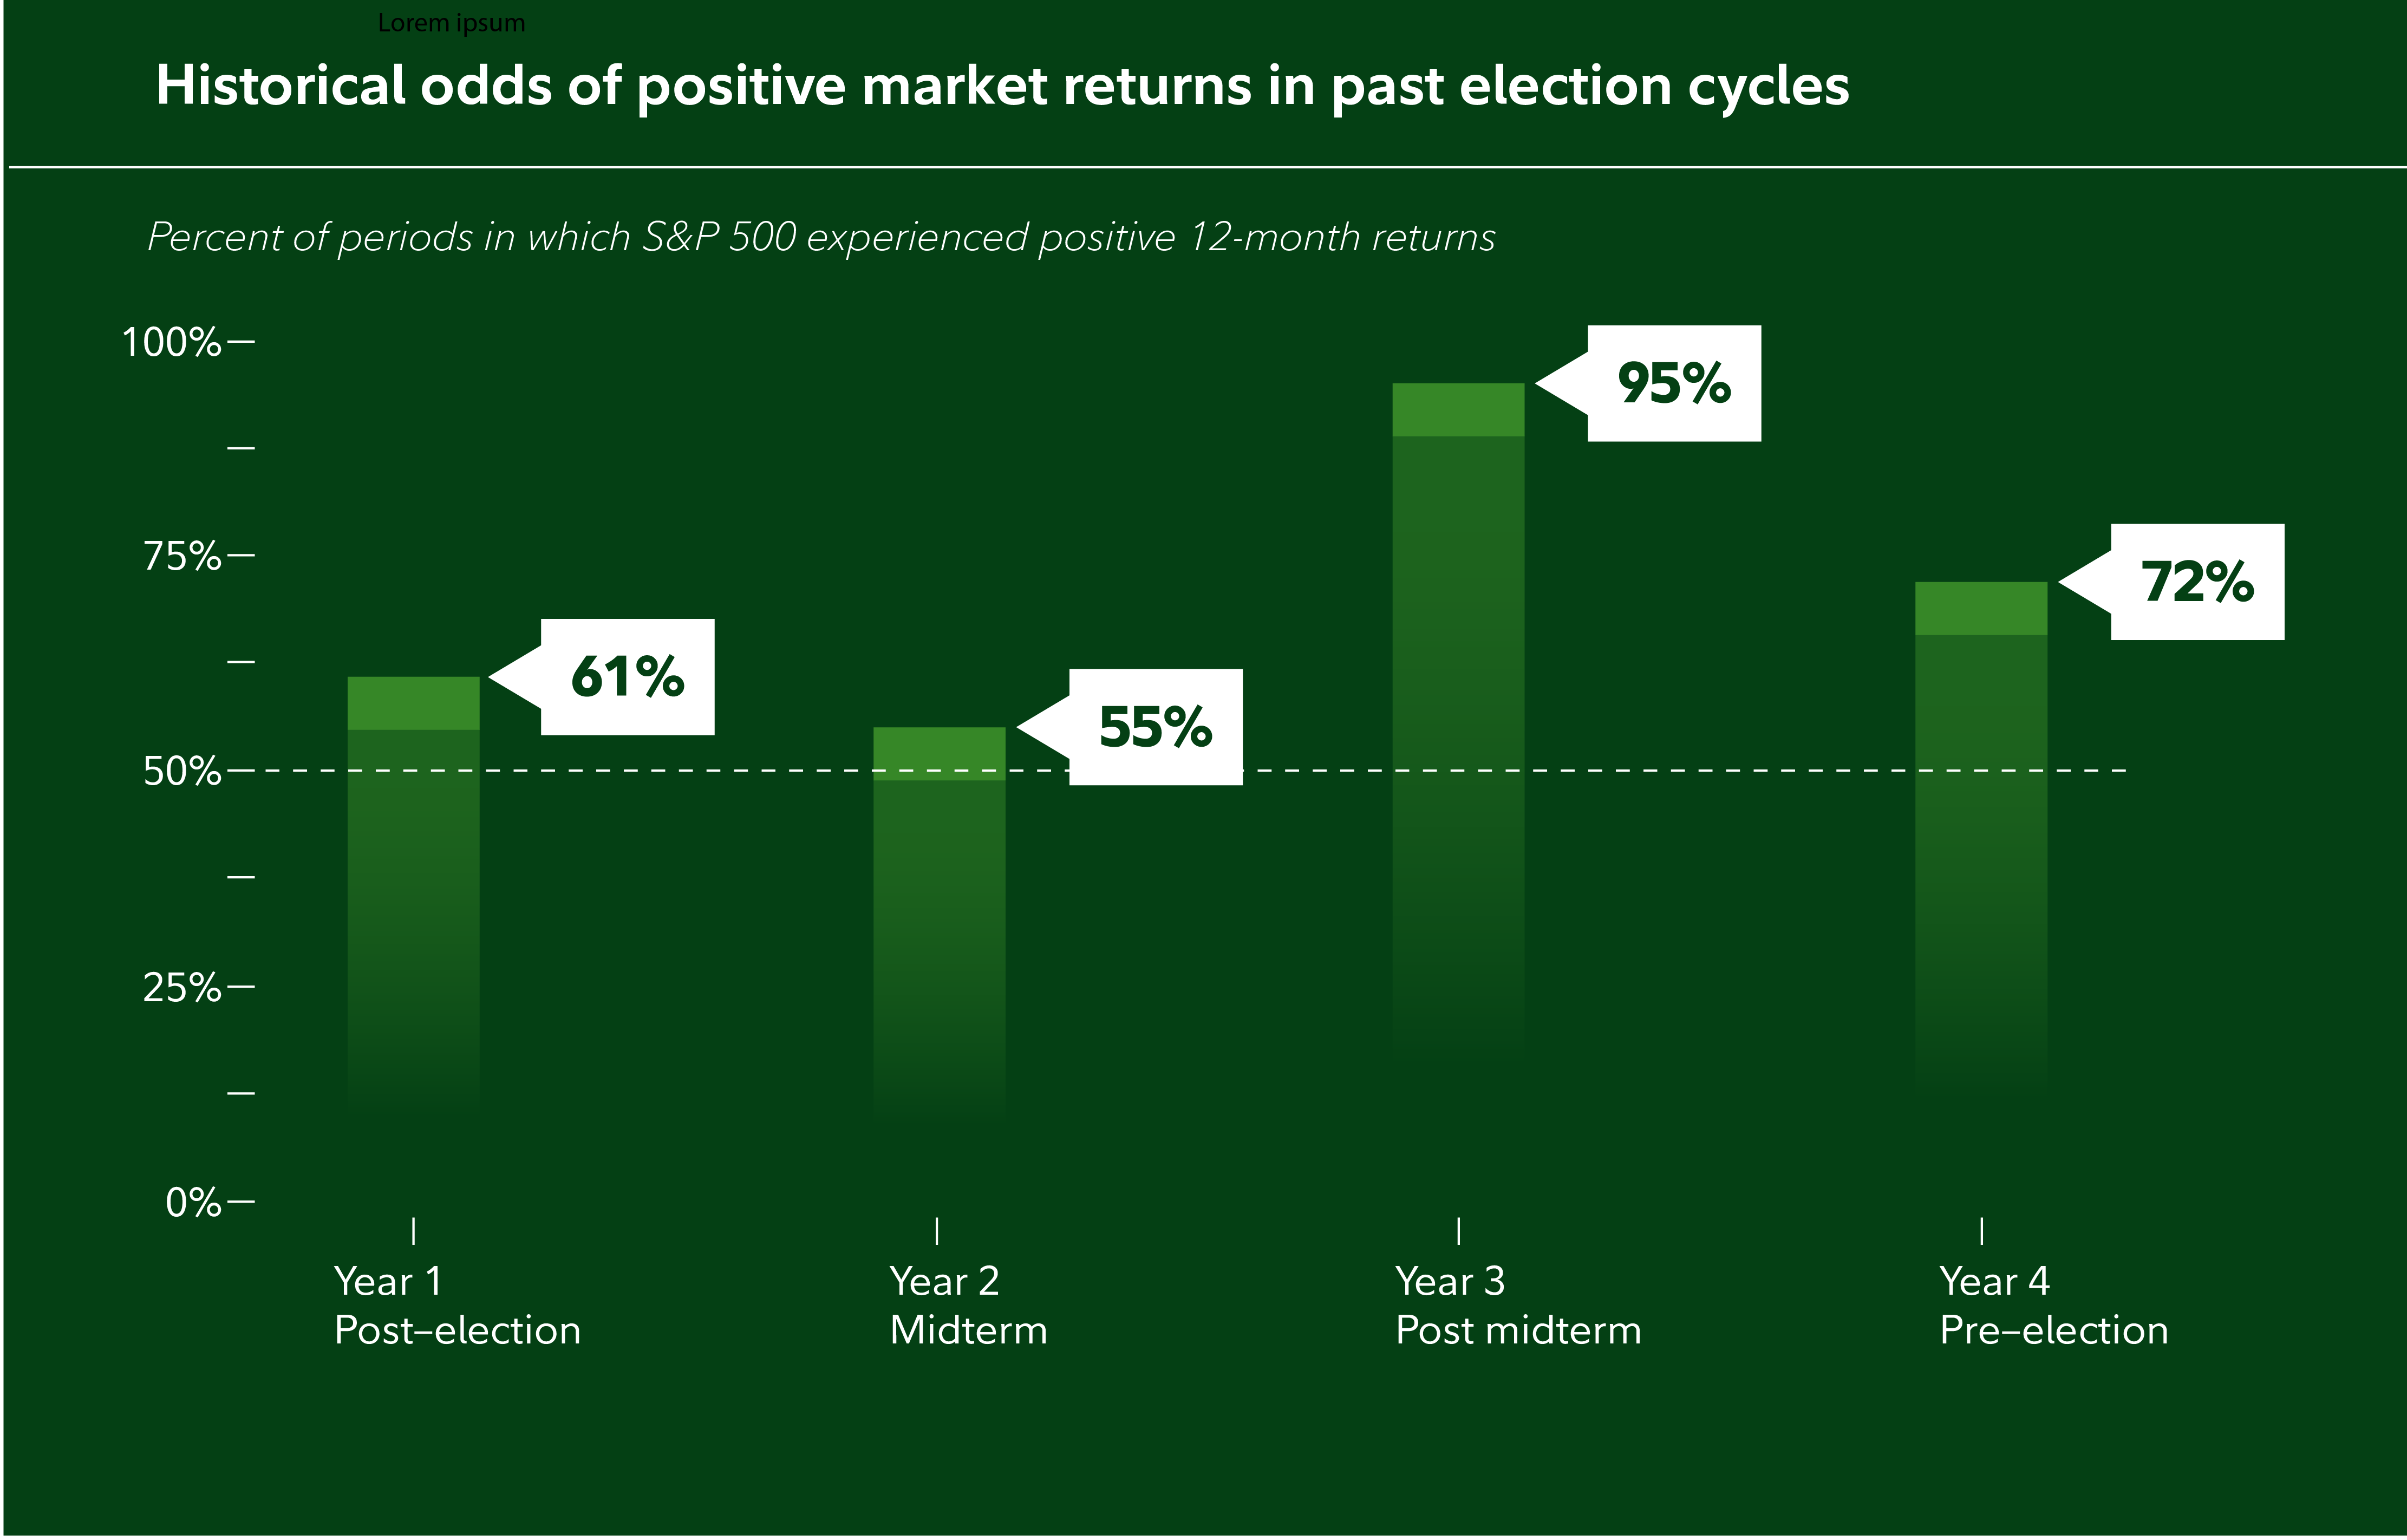
Source: Haver Analytics and Fidelity Investments.
Past performance is no guarantee of future results.
Methodology: Based on historical S&P 500 returns from 1950 to the present by election-cycle year. “Odds” represents the percentage of instances that the market went up (number of times the market went up divided by the total number of instances).
Historically, the party controlling the White House tends to lose congressional seats in midterm elections, increasing the likelihood of divided government. From a market perspective, divided government can reduce the probability of sweeping policy changes, making the policy environment easier for businesses and investors to assess.
Then investors can go back to basics, researching investments and analyzing economic metrics.
"Markets love gridlock," Gaggar says.
Why the 2026 midterm elections may impact markets differently
Many investors feel unusually uneasy heading into the 2026 midterms, and there may be a good reason.
The level of investor uncertainty surged earlier this year to more than 8 times its long-term average, according to the Economic Policy Uncertainty Index produced by the Federal Reserve Bank of St. Louis. The index tracks economic news coverage of key policies, such as tax provisions, and of disagreement among economists about the future of government policy.
While that uncertainty has subsided from earlier highs, it has remained elevated amid questions about the future of the Middle East conflict, US tariff policies, and how the Federal Reserve could address higher consumer prices.
Interestingly, Chisholm notes that periods of peak uncertainty have often been poor timing signals for investors. Historically, extreme pessimism has often faded as market conditions have become clearer. That, however, doesn't mean volatility can't increase in the months ahead.
"If all this uncertainty does translate into higher volatility, don't be shocked," Gaggar says. "It is quite typical for the markets to be volatile, even more so in election years."
For much of 2026, investors have been bullish on equities as expectations of strong earnings growth have offset concerns about the conflict in Iran, higher oil prices, inflation, and rising interest rates. While stocks fell 9% peak-to-trough in March, this decline was well below the 19% average drawdown seen in midterm years since 1961.
By mid-August, the S&P 500 had returned about 14% year-to-date. Still, the outlook for the remainder of 2026 has become cloudier as investors reassess their views on the AI buildout, whether stocks have been overvalued, and their confidence in the Fed’s ability to tame inflation.
How could the midterm election impact investors’ portfolios?
Elections may dominate headlines, but Fidelity's research suggests investors should pay closer attention to the factors that have historically mattered more for market performance, such as corporate earnings, business spending, and economic conditions.
Even as corporate earnings remain strong—the S&P 500’s earnings growth for the second quarter recently increased to 47% from 38%1—Fidelity's analysis suggests earnings may still have room to improve. The 6-year rolling average for per-share earnings growth is closer to a trough than to a peak and has recently been in the lowest quartile, based on data going back to 1962.
That could be encouraging news, because the S&P 500 typically posted positive returns in the following year more than 88% of the time when earnings growth began from similar levels. Business spending has also remained resilient in 2026, paced by massive capital expenditures (CapEx) on AI development.
Those factors may ultimately prove more meaningful for investors than the outcome of any individual race.
What should investors consider before a midterm election?
For most investors, the most important lesson may be behavioral rather than political. Election seasons create a powerful temptation to act. Headlines arrive around the clock, polls shift, forecasts change, and market predictions multiply.
Yet there’s little evidence that adjusting portfolios based on election forecasts improves long-term outcomes. Instead, Gaggar suggests focusing on the factors that investors can control:
- Review your financial goals.
- Reassess your risk tolerance.
- Rebalance if allocations have drifted.
- Avoid emotional decisions.
Elections can influence taxes, regulations, government spending, and public policy. But market history suggests they have rarely been the primary driver of long-term returns.
For investors, the larger risk may not be who wins in November: It may be abandoning a carefully constructed investment plan because of fears about the outcome. Historically, periods of peak political uncertainty have often given way to stronger market performance once things become even a little less unclear.
"Markets do react to headlines," Gaggar says. "But when you fade out the noise of the headlines, markets follow the trend lines of fundamentals."
If you’re an investor seeking help creating or revisiting a financial plan, you can work with Fidelity.