


Before deciding whether a stock belongs in your portfolio, it can be helpful to understand the underlying company’s financial condition. Financial ratios are one way to get information about how a company operates, how efficiently it uses its resources, and how well it can meet its obligations. One commonly used measure is the current ratio. Here’s what the current ratio is, how it’s calculated, and how it could clue investors in about a company’s financial stability.
What is the current ratio?
The current ratio is a measure of a company’s short-term liquidity. It compares current assets, such as cash and inventory, with current liabilities, or obligations due within a year. The ratio is sometimes referred to as the working capital ratio.
Why is current ratio important?
The current ratio is often used as a simple way to examine a company’s short‑term financial position. Because it focuses on assets and liabilities due within a year, it can provide context about how a company manages its near‑term obligations.
A low or relatively weak current ratio—especially when compared with similar companies or a company’s past results—may point to financial pressure. For example, a declining ratio over time could reflect rising debt or challenges generating revenue. On the other hand, a very high current ratio may suggest that a company is holding more assets than it needs for day‑to‑day operations, which could limit reinvestment or growth.
For these reasons, the current ratio is commonly used to:
- Gain a general view of a company’s short‑term financial position
- Compare current results with the company’s historical averages
- Assess how a company’s liquidity compares with that of its peers and identify potential differences
Current ratio formula
The formula for calculating a company’s current ratio is:
Current ratio = current assets ÷ current liabilities
Current assets are items on a company’s balance sheet that are expected to be used, sold, or turned into cash within about 12 months. Examples include cash, accounts receivable, inventory, marketable securities, and prepaid expenses.
Current liabilities are obligations a company is expected to pay within about 12 months. These can include accounts payable, accrued expenses such as wages or utilities, short‑term loans, taxes owed, unearned revenue, and the portion of long‑term debt due within the year.
How to calculate current ratio
Calculating the current ratio involves dividing a company’s current assets by its current liabilities. The result is expressed as a single number, which represents how current resources compare with short‑term obligations.
For publicly traded companies, information about assets and liabilities is typically available on the balance sheet included in quarterly and annual financial statements.
Example of how to calculate a current ratio
The examples below show how the current ratio is calculated using the same formula, with different asset and liability amounts:
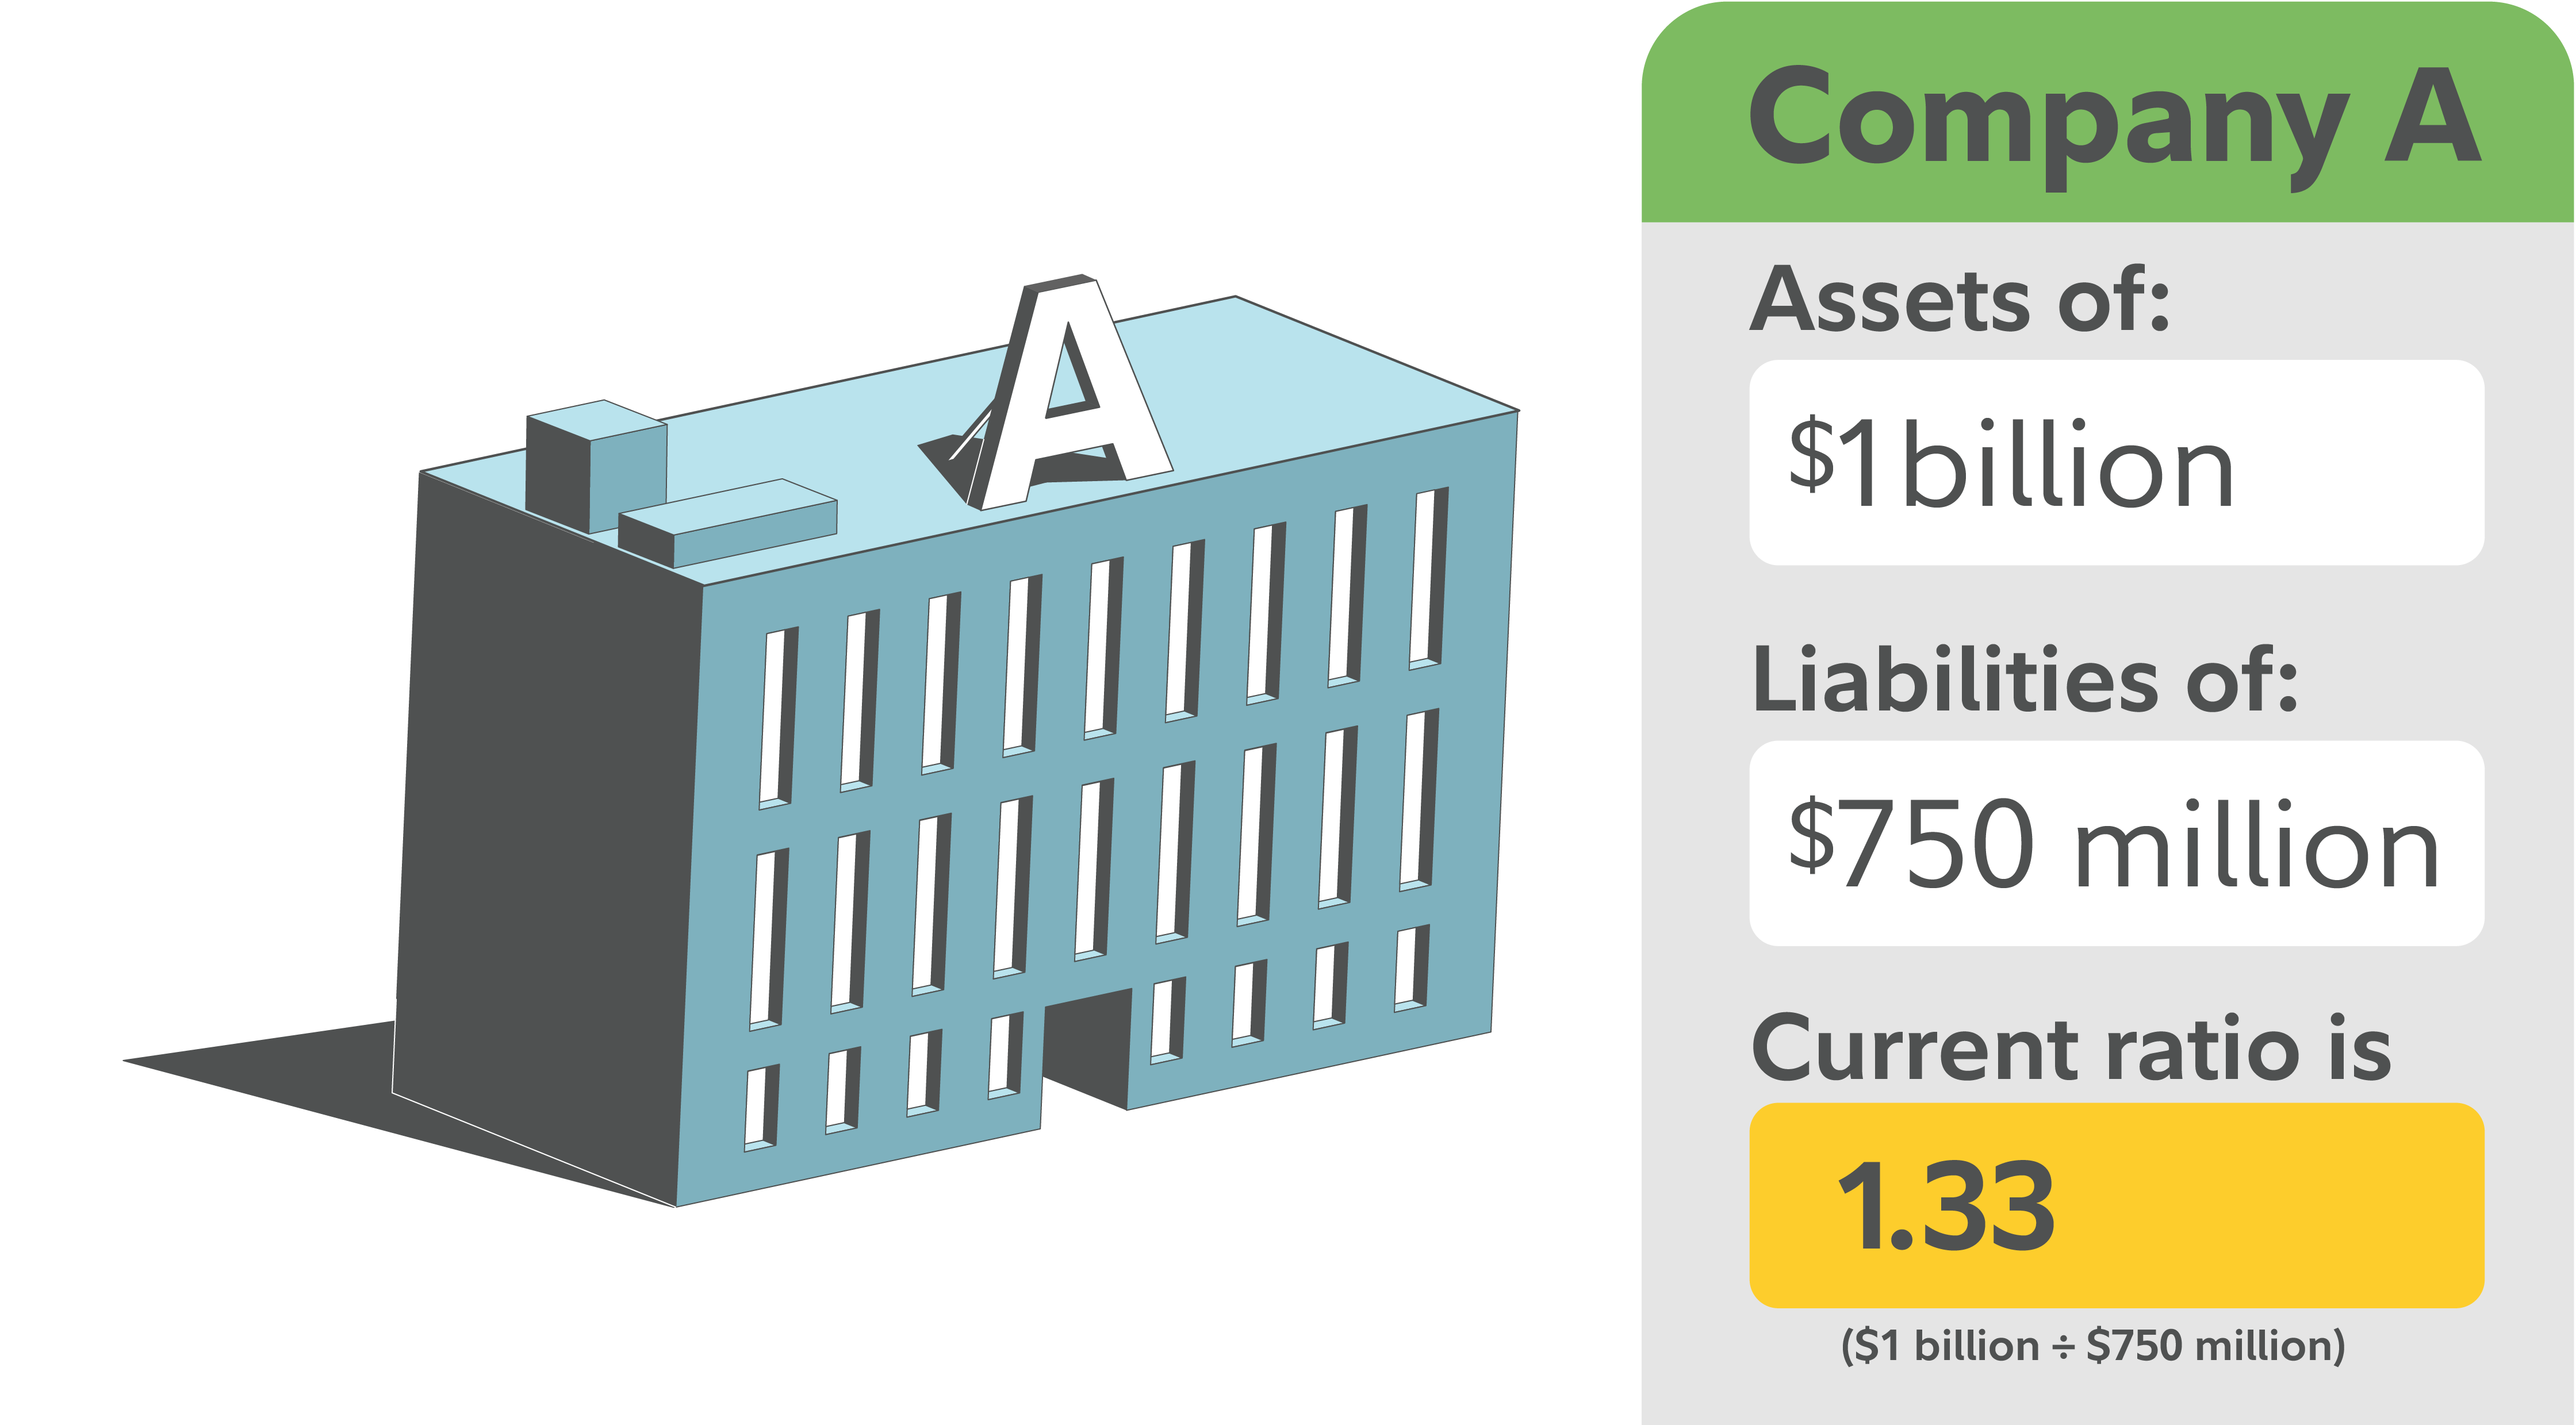
- If Company A has current assets of $1 billion and current liabilities of $750 million, its current ratio is 1.33 ($1 billion ÷ $750 million). This suggests that its short-term assets are larger than its short-term obligations.
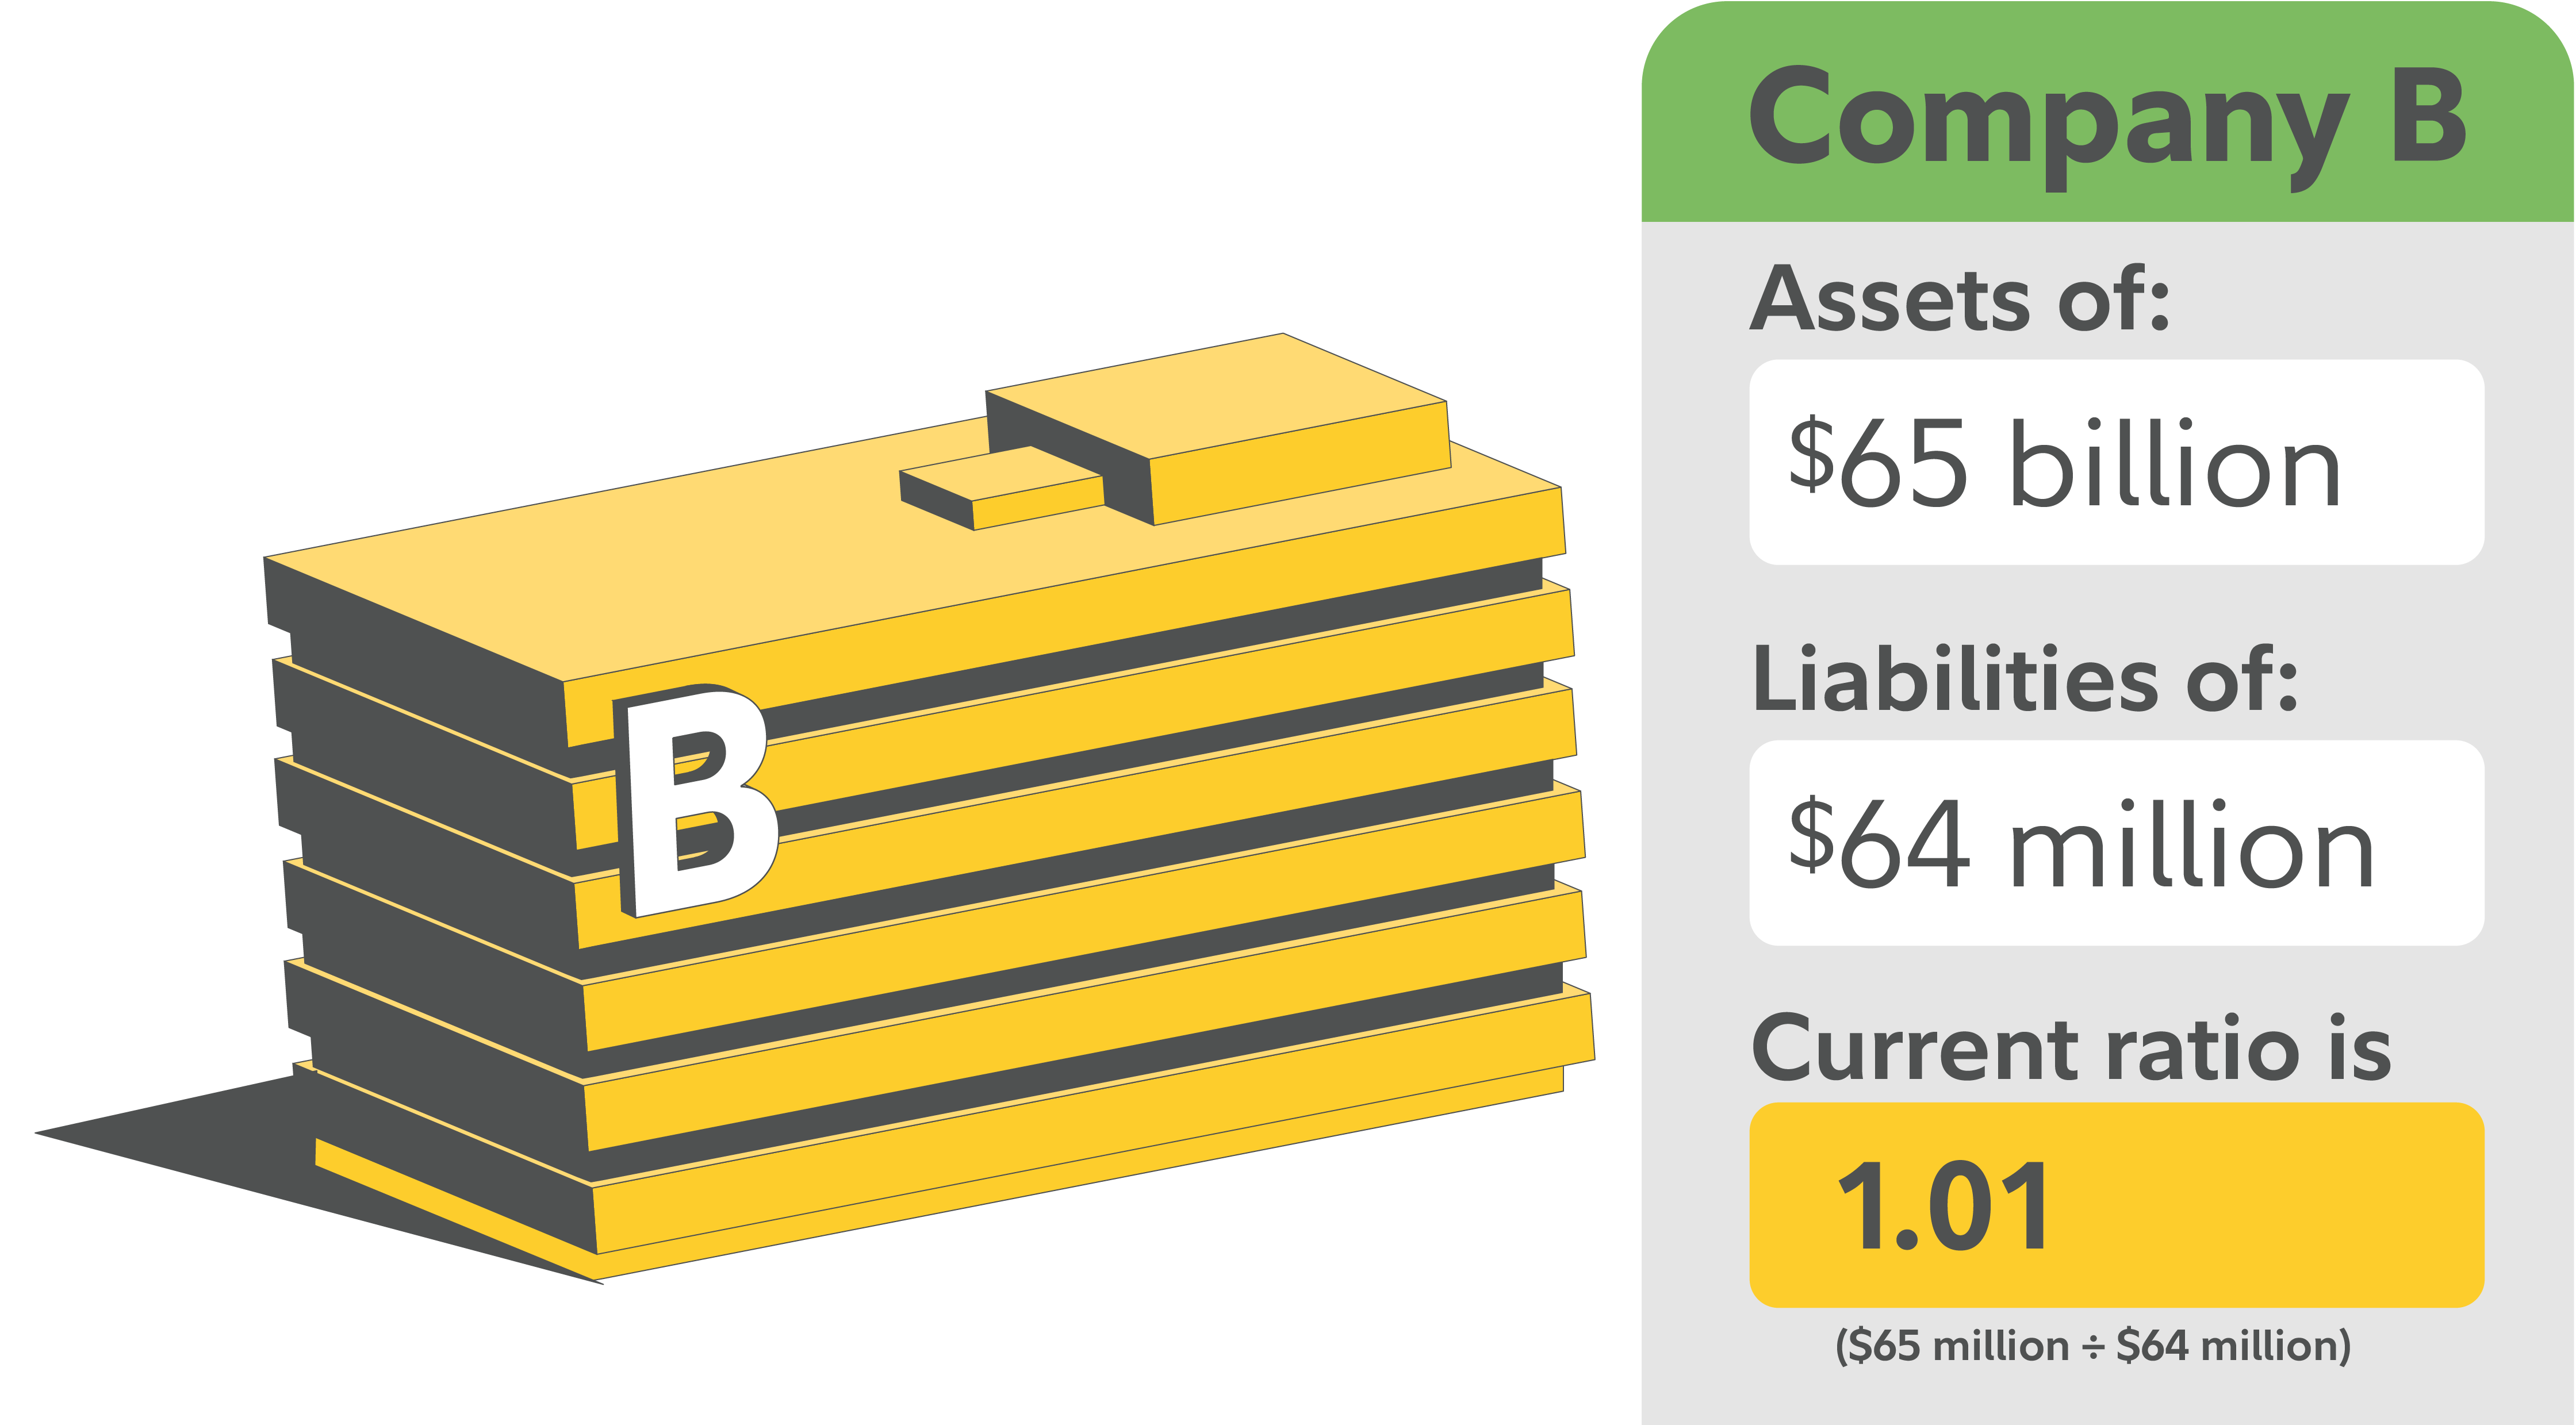
- If Company B has $65 million in current assets and $64 million in current liabilities, its current ratio is 1.01 ($65 million ÷ $64 million). This shows that its short-term assets and liabilities are close in size.
- If Company C has current assets of $30 billion and current liabilities of $35 billion, its current ratio is 0.85 ($30 billion ÷ $35 billion). This means its short‑term obligations are larger than its short‑term assets.

What is a good current ratio?
What counts as a “good” current ratio can vary by industry. Some businesses require large upfront investments, face uneven short-term expenses, or generate cash quickly, while others do not. Because of this, the current ratio is often evaluated in relation to industry averages rather than on its own.
That said, analysts commonly reference a range of greater than 1.0 but below 3.0 as a general benchmark. Ratios in this range suggest that a company has more current assets than current liabilities, leaving some cushion for routine expenses or unexpected changes.
A current ratio below 1.0 means a company’s short‑term obligations are greater than its short‑term assets. This can raise questions, but it isn’t always a problem. For example, some companies can raise cash quickly through inventory sales, financing, or investment inflows, or operate in industries with fluctuating cash cycles.
A current ratio above 3.0 may need a closer look. While it suggests the company has plenty of short-term assets, it can also mean that money is tied up in things like inventory or sitting idle instead of being actively invested or used to grow the business.
Advantages of current ratio
The main advantage of the current ratio is that it offers a basic way to look at a company’s short‑term liquidity. It can provide context about how a business’s current assets compare with its current obligations. Other commonly noted advantages include:
- Ease of use: The current ratio is straightforward to calculate, and the needed figures are usually available on a company’s balance sheet.
- Comparative analysis: The ratio can be used to compare a company with others in the same industry, which may help highlight similarities or differences in short‑term financial positions.
- Historical analysis: Looking at how a company’s current ratio changes over time can show whether its short‑term financial balance has been relatively stable or has shifted.
Limitations of current ratio
One limitation of the current ratio is that it reflects a single point in time. It shows short-term assets and liabilities at the moment the financial statements were prepared, which may not capture changes that occur later. Other limitations include:
- Industry variance: Companies operate differently across industries, especially in how they manage cash, inventory, and payments. As a result, current ratios that appear low or high may be typical for certain types of businesses.
- Lack of specificity: The current ratio counts all current assets equally, including items that may take time to sell or turn into cash. This means a higher ratio does not always indicate readily available liquidity.
Current ratio vs. other liquidity measures
The current ratio is one way to look at a company’s short‑term liquidity, but it is usually more informative when considered alongside other measures. Ratios such as the quick ratio and cash ratio focus on slightly different aspects of a company’s ability to meet short‑term obligations and can add context.
Current ratio vs. quick ratio
Like the current ratio, the quick ratio (sometimes called the acid‑test ratio) looks at whether a company may be able to cover its short‑term obligations. The key difference is that the quick ratio includes only assets that are generally easier to convert into cash in the near term. These typically include cash, cash equivalents, marketable securities, and accounts receivable.
Quick ratio = (cash + cash equivalents + marketable securities + accounts receivable) ÷ current liabilities
Because it excludes inventory, prepaid expenses, and other less‑liquid assets, the quick ratio is often viewed as a more conservative measure than the current ratio.
Cash ratio
The cash ratio is even more limited in scope. It considers only cash and cash equivalents when comparing assets with short‑term obligations.
Cash ratio = (cash + cash equivalents) ÷ current liabilities
A cash ratio of 1.0 or higher suggests a company could pay current liabilities using cash alone. While this may indicate strong liquidity, most companies typically rely on a mix of cash and other short‑term assets to meet obligations.
How to use the current ratio when investing
The current ratio can be used as a reference point when looking at a company’s short‑term financial position, especially when combined with other information. Common ways it is used include:
1. Calculating the current ratio using recent financial statements
(Current ratio = current assets ÷ current liabilities)
2. Reviewing how the ratio has changed over time
To see whether short-term assets and liabilities have remained relatively consistent or shifted, you may review how the ratio has changed over time, such as over the past several years.
3. Comparing the ratio with similar companies in the same industry
This helps to understand how it aligns with peer businesses.
4. Looking at the current ratio alongside other liquidity measures
To build a more complete picture of short-term liquidity, you may look at the current ratio alongside other liquidity measures, such as the quick ratio and cash ratio.
How to calculate your personal current ratio
You can calculate your own personal ratio using a personal balance sheet to determine if you have enough cash on hand to pay off immediate debts and upcoming bills.
Personal current ratio = liquid assets ÷ current liabilities
In this case, your liquid assets are the types of money you can access quickly, such as money in your checking and savings accounts, physical cash, money market funds, and short-term certificates of deposit (CDs) that are easy to convert to cash. Retirement accounts like a 401(k), as well as assets like a car or house, are not included because they take time to sell or may involve penalties to access.
Your current liabilities are the bills you need to pay soon, such as credit card balances, medical bills, utility payments, and any loan payments due within the next month.
For example, if you have $5,000 in cash and savings and owe $2,000 in upcoming bills, your personal current ratio would be 2.5.
While this ratio can be helpful, it should not be used on its own. It is also important to look at other measures, such as your regular income, savings for emergencies, and overall debt compared to your income.