


Stocks surged across most sectors and yields fell as oil prices plunged after the US midterm elections. As the election uncertainty dissipated, the S&P 500 gained nearly 2% and the Dow rallied more than 3% on November 4.
What happened with the elections?
The Democrats will take control of the House of Representatives and Senate in January. Democrats also had a string of victories in several governor races and at the local level.
"The election sets up divided government in 2027, with Democrats controlling Congress and Republicans the White House,” notes Greg Lowman, vice president of advocacy and policy communications at Fidelity. “The focus now shifts to how that balance shapes fiscal policy, regulation, trade, and other key policy priorities.”
What the election might mean for markets
While it’s still too early to tell how markets are going to fully digest the results, in addition to the outcome of several races that are still to be decided, there are some takeaways for investors to consider.
“Markets like gridlock and that’s what we got,” says Jurrien Timmer, direct of global macro at Fidelity. “Also, a balanced Congress could result in less government interaction with the Fed, which I think historically the market looks at as constructive.”
Consumer sectors led the rally on Wednesday as oil prices slid more than 8%, and communication services and technology stocks gained as well.
“It’s possible the blue wave could limit the growth of data centers, which may help already established hyperscalers (companies providing the infrastructure for the AI buildout) and might therefore be good for the entrenched Mag 7,” Timmer adds.
Looking further out, what does history say? Since 1938, the S&P 500® almost always—95% of the time—posted price gains in the 12 months following midterms. Similarly, stocks have generated average returns of roughly 5% during the second year of a presidential term, though that average masks a wide variation in returns from one election cycle to the next. On average, those returns have jumped to 14% in the following 12 months.
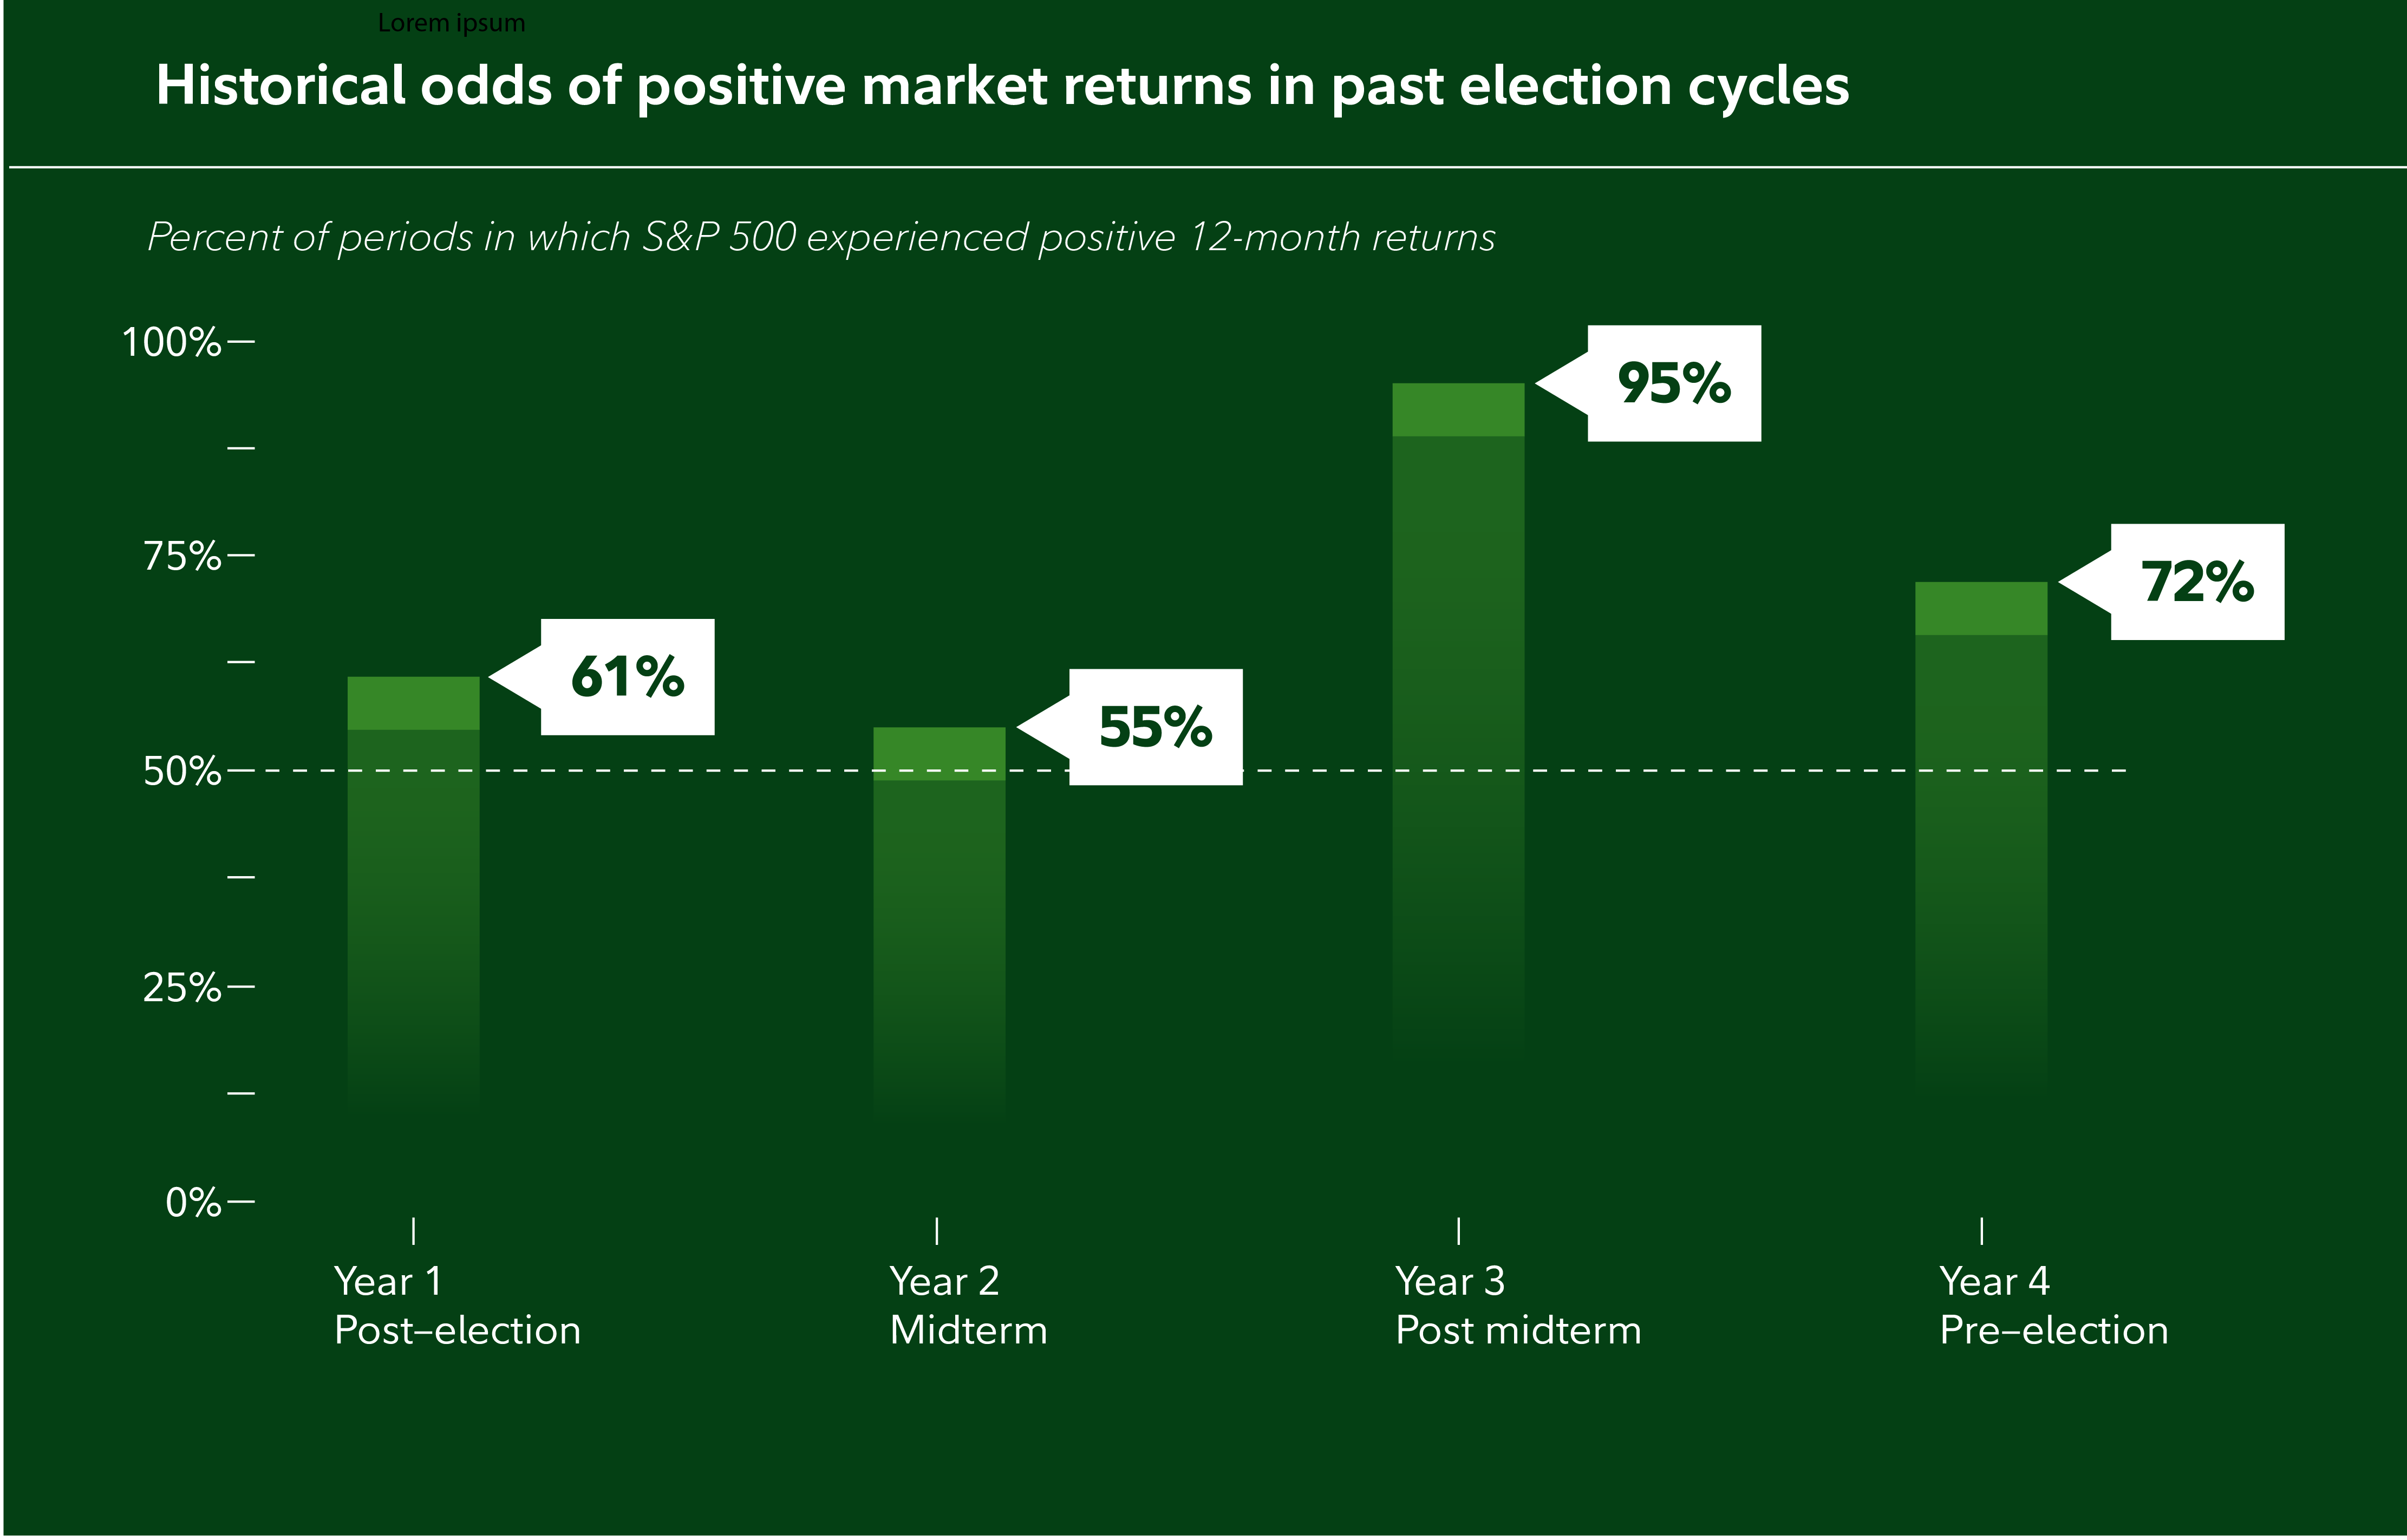
Source: Haver Analytics and Fidelity Investments.
Past performance is no guarantee of future results.
Methodology: Based on historical S&P 500 returns from 1950 to the present by election-cycle year. “Odds” represents the percentage of instances that the market went up (number of times the market went up divided by the total number of instances).
Investing implications
Of course, election results in and of themselves shouldn’t fundamentally alter your plan. You should continue to focus on corporate earnings, business spending, and economic conditions, among other factors specific to your strategy. While the midterms will change the balance of power in Washington DC, they should not alter your investing plan.