The case for staying investedMissing a handful of the market's best days can significantly reduce investment returns. |
When markets fall, it's natural to feel stressed. In fact, in times of market volatility, some investors may be tempted to pull their money out of the market entirely. However, not being invested can come with its own set of risks, particularly if markets rebound.
For example, an investment of $10,000 in the S&P 500® Index in 1988 would have grown to a value of $522,576 by December, 2024 – if that portfolio had remained invested. Yet, missing out on even a handful of the best days over that period would have greatly reduced the portfolio's value.
Hypothetical growth of $10,000 invested in S&P 500® Index
January 1, 1988–December 31, 2024
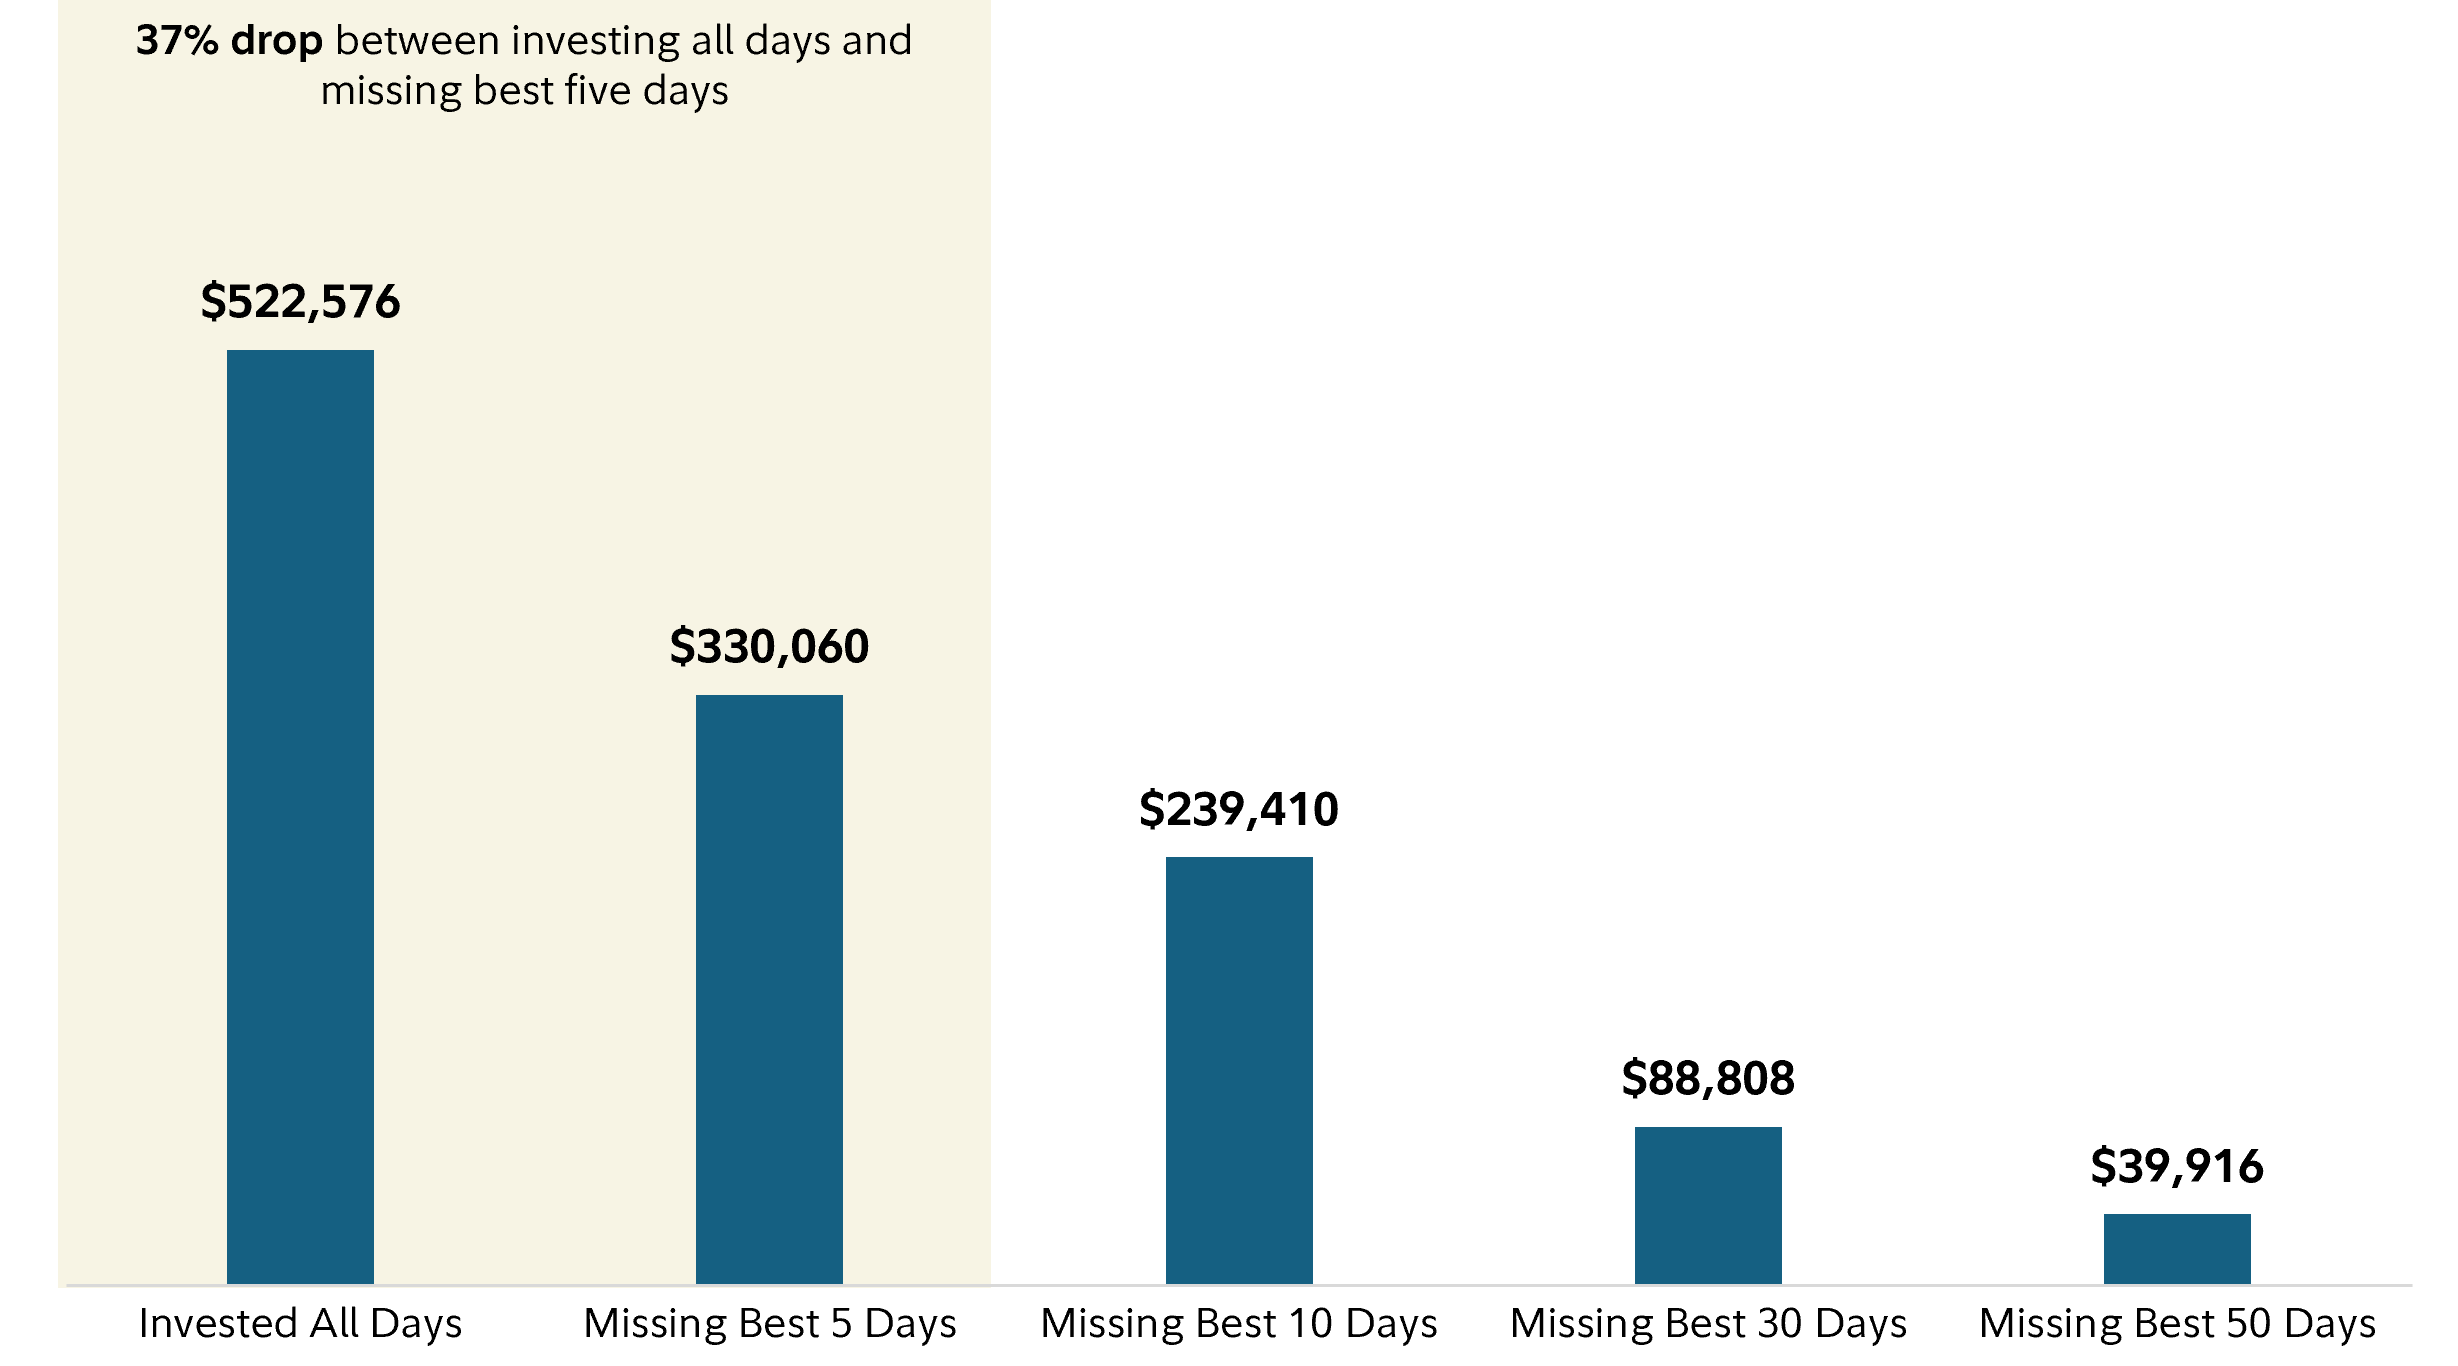
Past performance is not a guarantee of future results. The hypothetical example assumes an investment that tracks the returns of a S&P 500® Index and includes dividend reinvestment but does not reflect the impact of taxes, which would lower these figures. "Best days" were determined by ranking the one-day total returns for the S&P 500® Index within this time period and ranking them from highest to lowest. There is volatility in the market and a sale at any point in time could result in a gain or loss. See important information for index definitions. Your own investment experience will differ, including the possibility of losing money. Indexes are unmanaged. It is not possible to invest directly in an index. Please see Important Information for index definitions. Source: Fidelity Investments, Bloomberg as of 12/31/24.
TOP 50 DAYS WITH THE HIGHEST RETURNS IN THE S&P 500® INDEX
JANUARY 1980-DECEMBER 2024
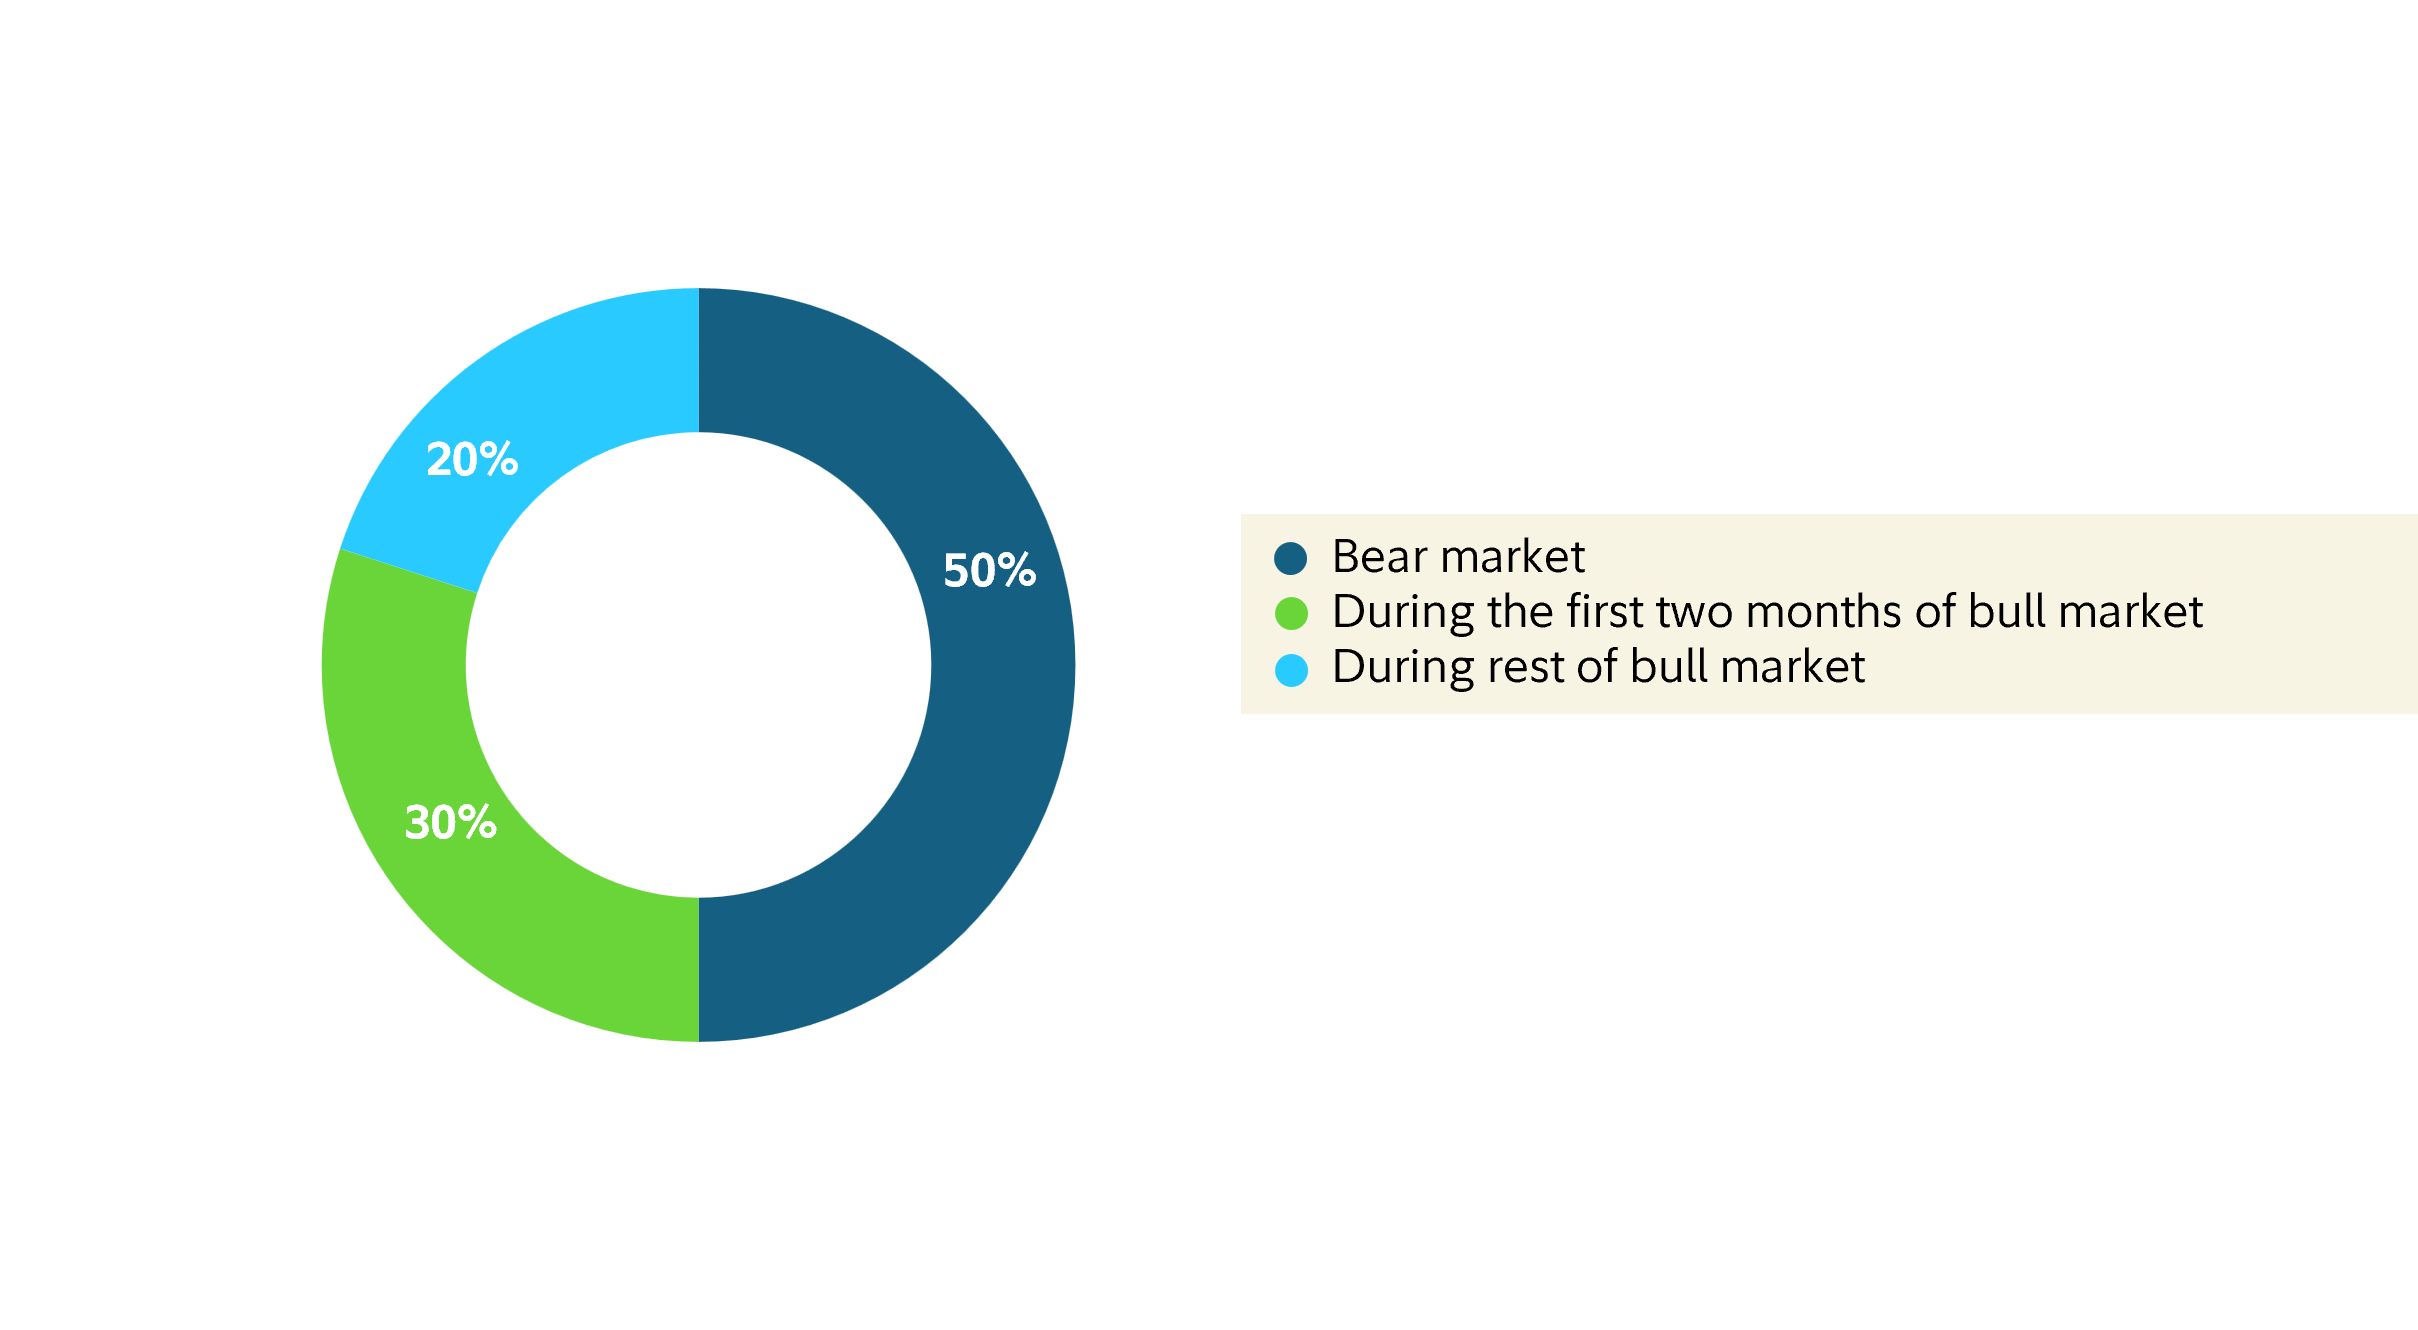
A bear market is defined as a 20% drop in the S&P 500® Index from a previous high. A bull market is defined as a period in which stocks increase by 20% over an extended period of time. Past performance is no guarantee of future results. Stocks are represented by the S&P 500® Index . This is for illustrative purposes only and not indicative of any investment. It is not possible to invest directly in an index. All indexes are unmanaged. Important Information for index definitions. Measures the 50 best one-day returns of the S&P 500® Index from 01/01/1980 to 12/31/2024.
We're here to help you through challenges when market volatility occurs. Backed by deep research and experience, we remain patient and disciplined through periods of market distress. By taking a long-term view, investors who stay invested may have a better chance of reaching their financial goals.
As shown below, significant gains in the stock market have often occurred following some steep declines. Investors who abandon their strategy during a market downturn may miss out on those gains. By taking a long-term view, investors who stay invested may have a better chance of reaching their financial goals.
STOCKS HAVE EXPERIENCED SIGNIFICANT GAINS DURING ECONOMIC EXPANSIONS
January 1, 1950-December 31, 2024
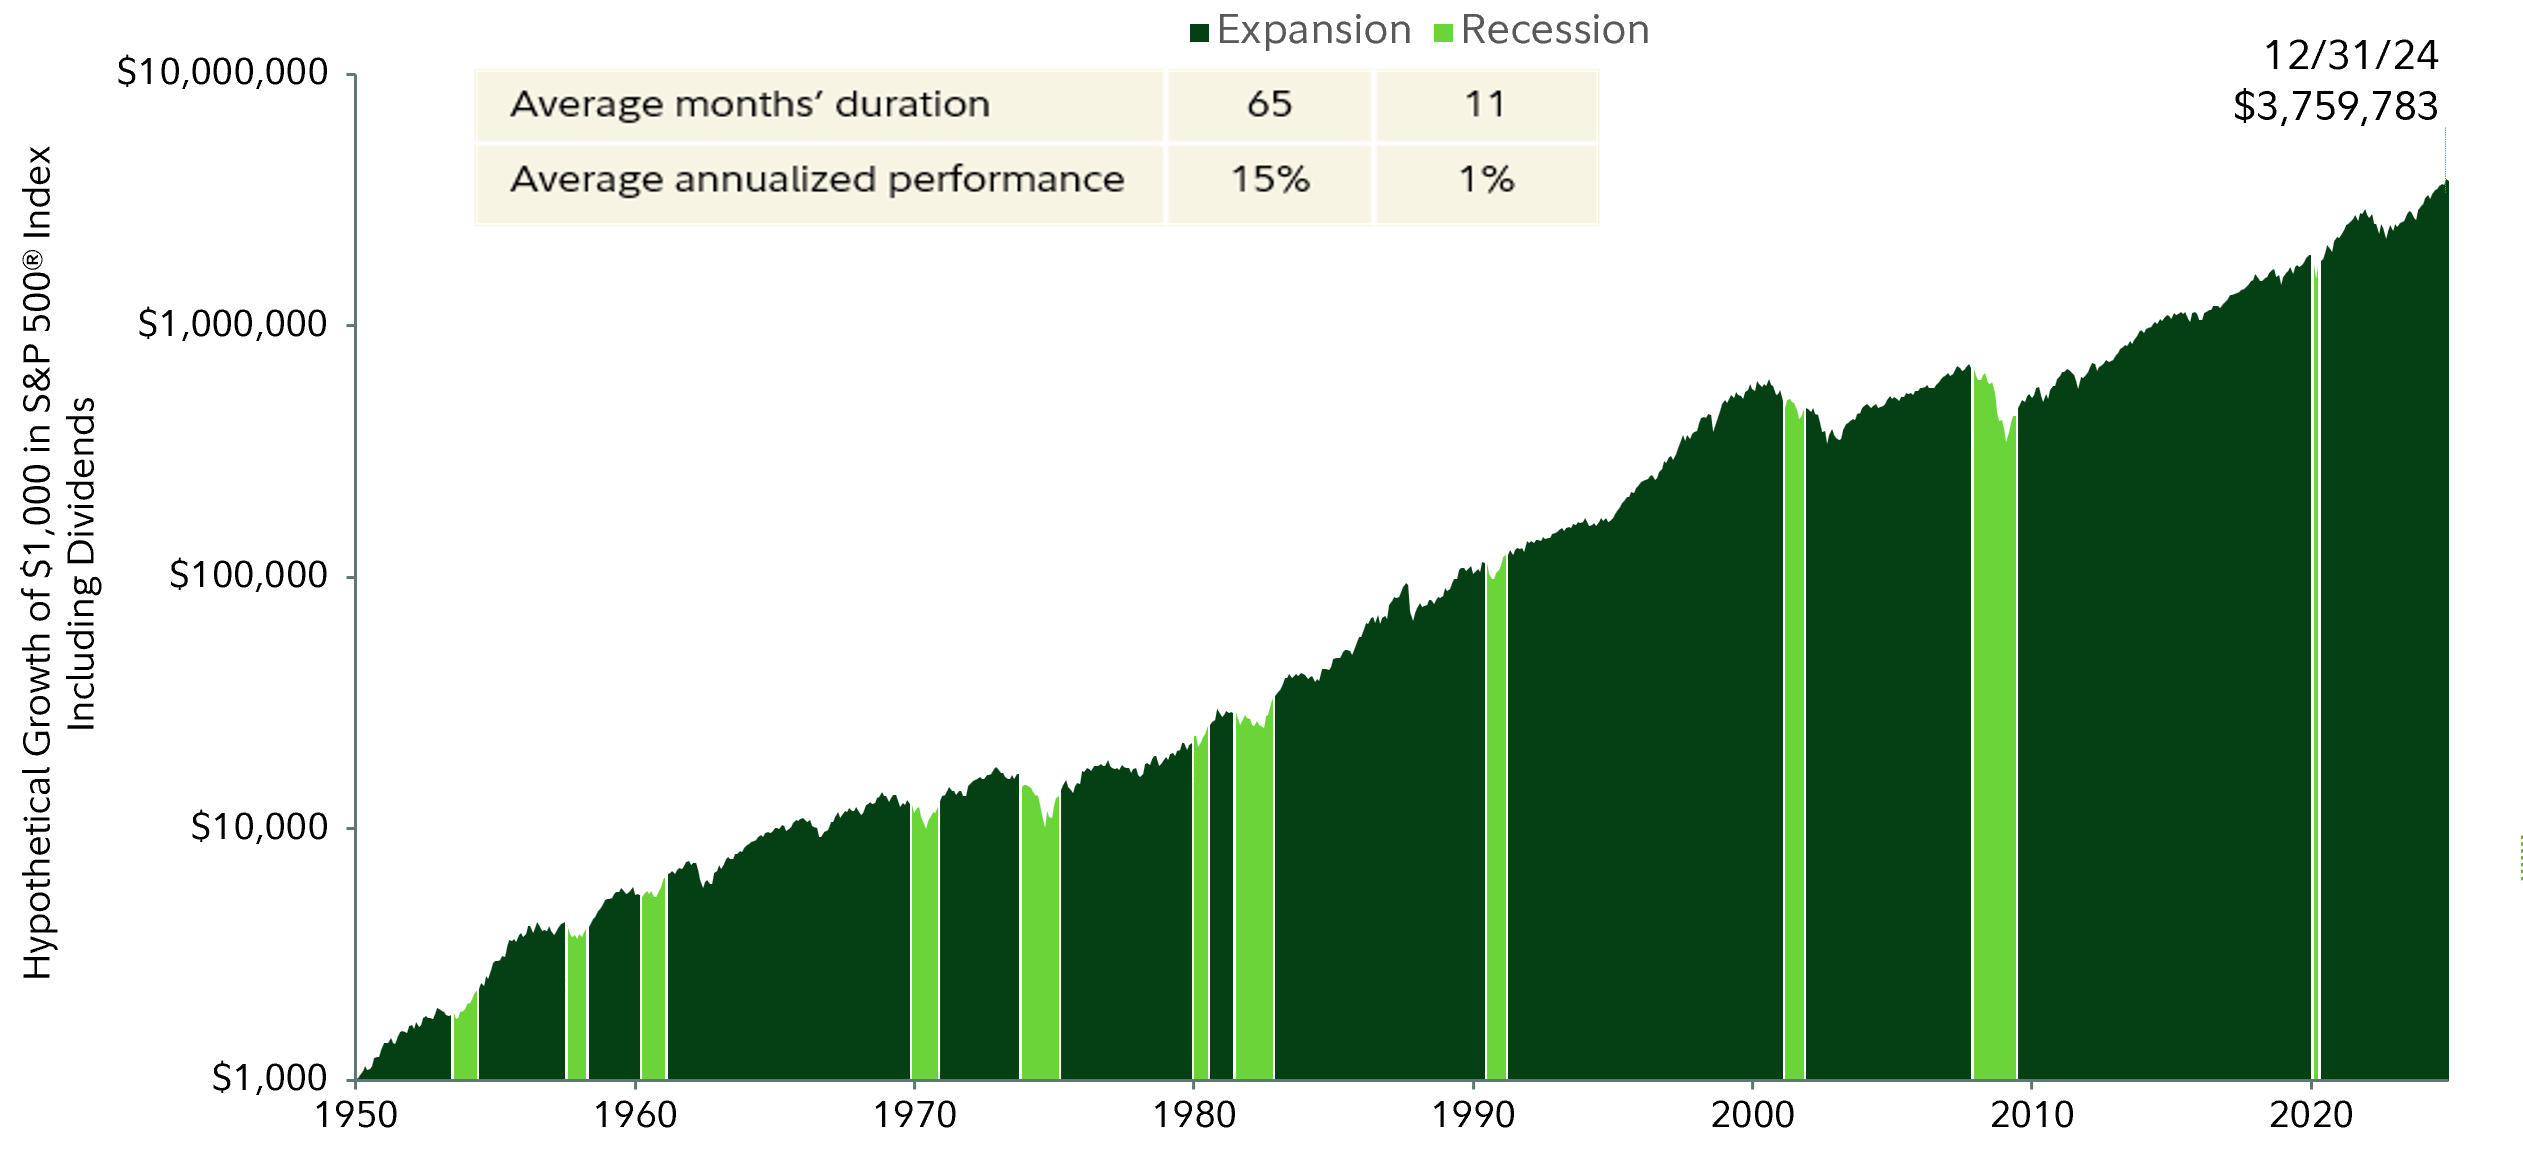
This chart illustrates the cumulative percentage return of a hypothetical investment made in the noted index during periods of economic expansions and recessions. Index returns include reinvestment of capital gains and dividends, if any, but do not reflect any fees or expenses. This chart is not intended to imply any future performance of the investment product. Past performance is no guarantee of future results. It is not possible to invest directly in an index. All indexes are unmanaged. Source: Bloomberg, S&P 500® Index total return for 12/31/1949 to 12/31/2024; recession and expansion dates defined by the National Bureau of Economic Research (NBER). The S&P 500® Index was created in 1957; however, returns have been reported since 1926, and the index has been reconstructed for years prior to 1957. See Important information—index definitions.
We're here to help you through challenges when market volatility occurs. Backed by deep research and experience, we remain patient and disciplined through periods of market distress.
Historically, stocks have tended to continue rise further after reaching all-time highs, with selloffs being unusual.
Cumulative S&P500' index total return and its all-time highs 1/1/1950—12/31/2024
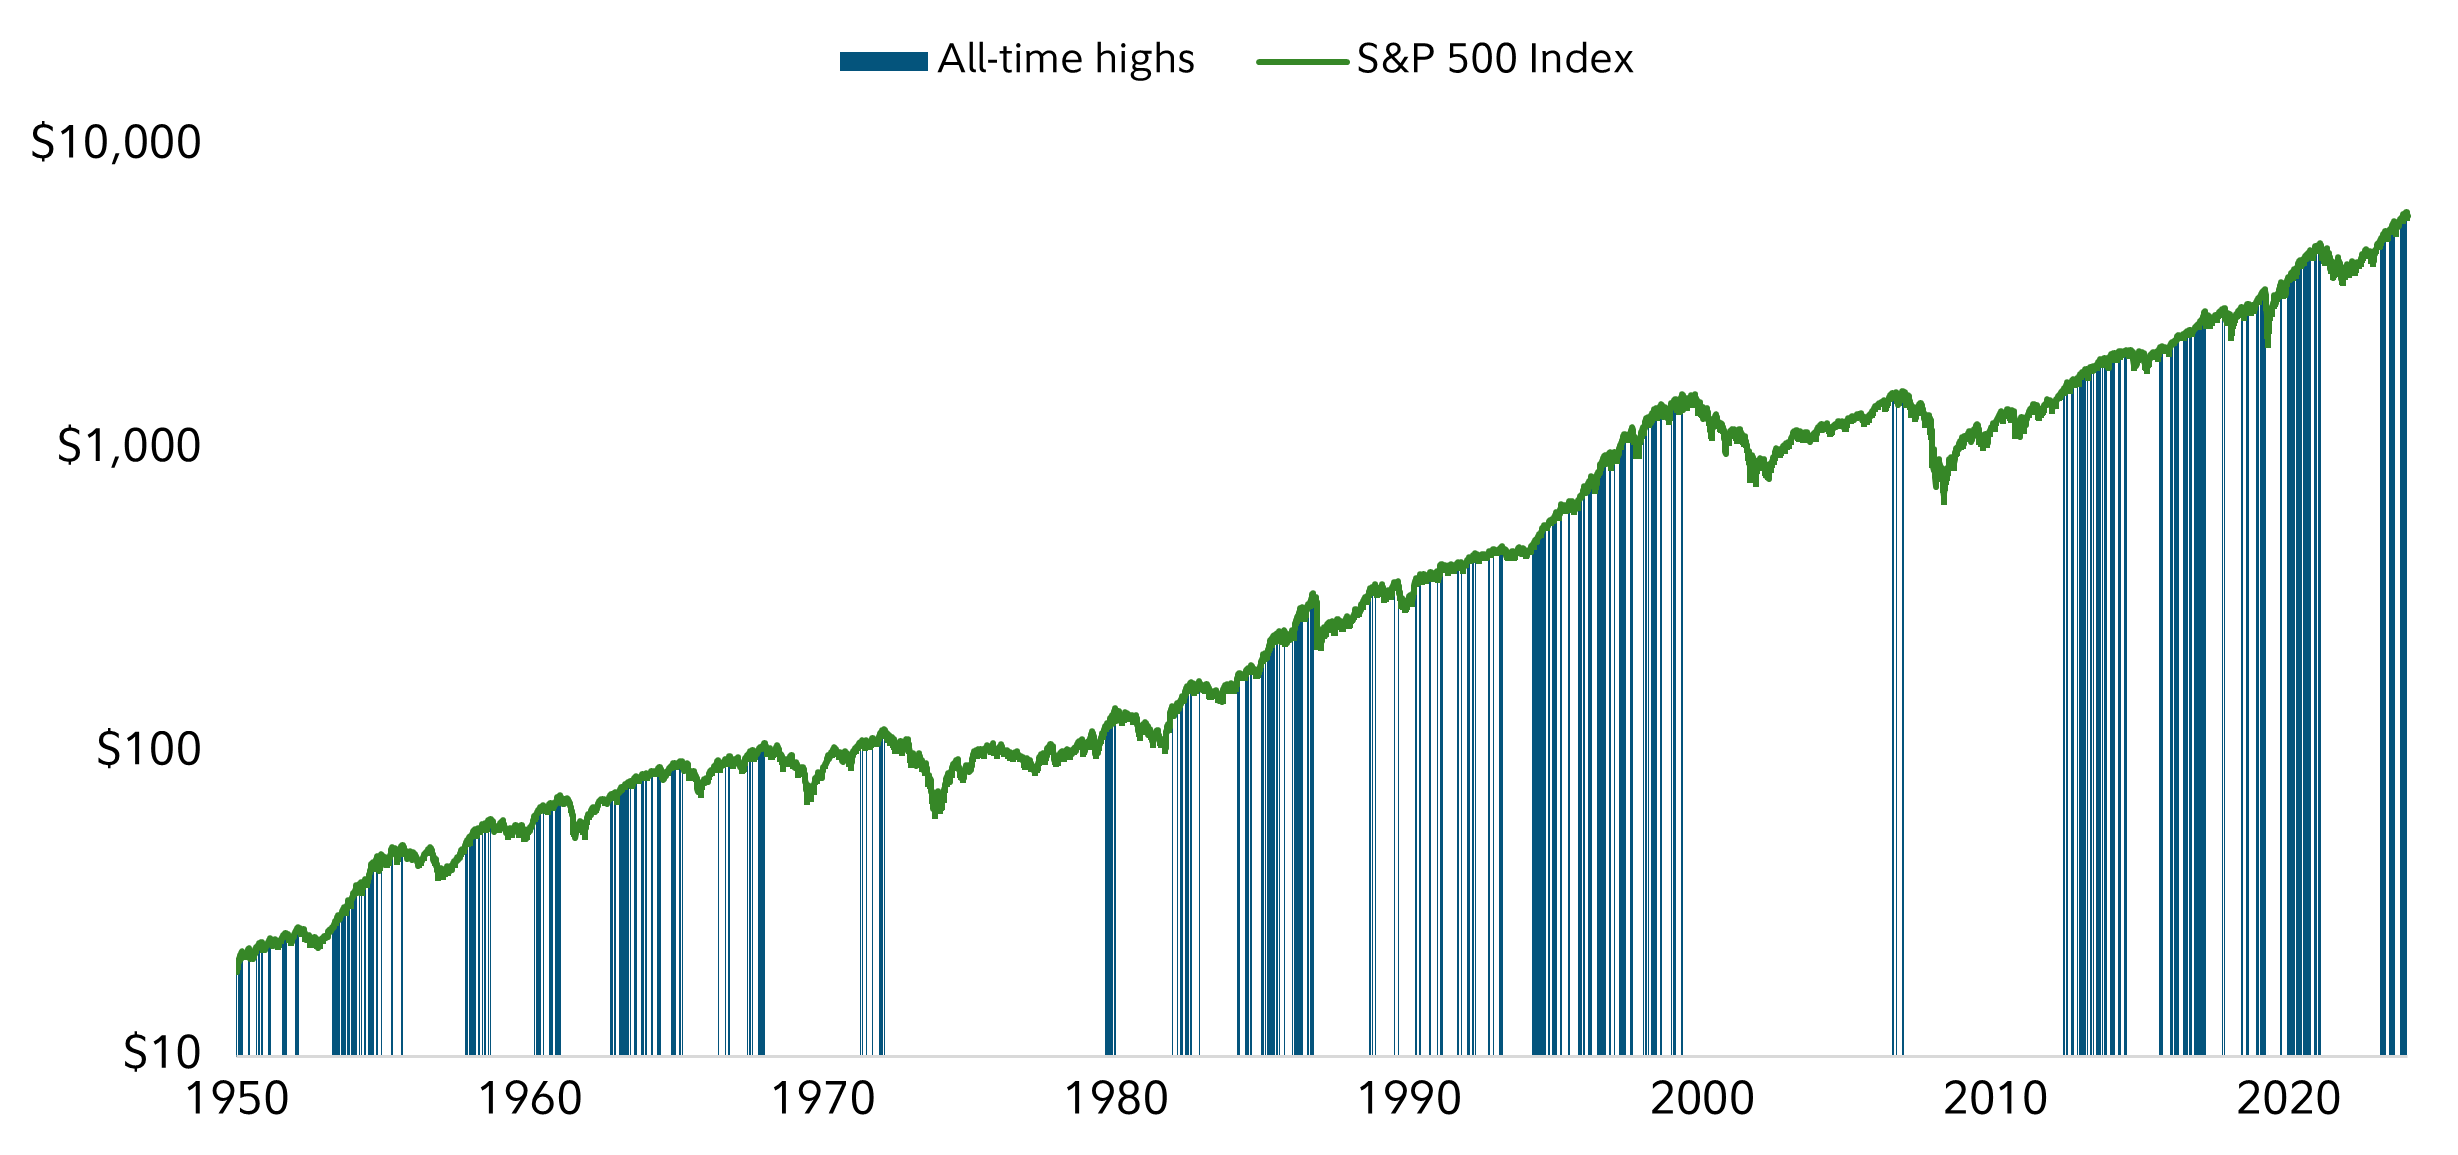
Past performance is no guarantee of future results. Source: Bloomberg Finance, L.P., from 12/31/1949 to 12/31/2024, daily data. U.S. stocks are represented by the S&P 500® index. It is not possible to invest directly in an index. All indexes are unmanaged. Please see Important Information for index definitions. Average 1-year total return was 12.4% over this time period.
The Dow Jones U.S. Total Stock Market Index is an all-inclusive measure composed of all U.S. equity securities with readily available prices. This broad index is sliced according to stock-size segment, style, and sector to create distinct sub-indexes that track every major segment of the market. The S&P 500® index is a market capitalization-weighted index of 500 common stocks chosen for market size, liquidity, and industry group representation to represent U.S. equity performance.
The Bloomberg US Aggregate Bond Index is a broad-based flagship benchmark that measures the investment-grade, U.S. dollar-denominated, fixed-rate taxable bond market. The index includes Treasuries, government-related and corporate securities, mortgage-backed securities (agency fixed-rate pass-throughs), asset-backed securities, and collateralized mortgage-backed securities (agency and non-agency).
The MSCI All Country World Ex-USA Index (Gross) is a market capitalization-weighted index designed to measure the investable equity market performance for global investors of large– and mid–cap stocks in developed and emerging markets, excluding the United States.
The MSCI World Index captures large- and mid-cap representation across 23 Developed Markets (DM) countries. With 1,480 constituents, the index covers approximately 85% of the free float-adjusted market capitalization in each country.
The MSCI EAFE Index is a stock market index that measures the performance of large– and mid–cap companies across 21 developed markets countries around the world.