Rebalancing is keyRebalancing can help you remain properly invested as markets shift. |
Over time, certain asset classes may outperform others, particularly during periods of extreme market movement. This can create changes in your portfolio that could alter the level of risk you're taking on.
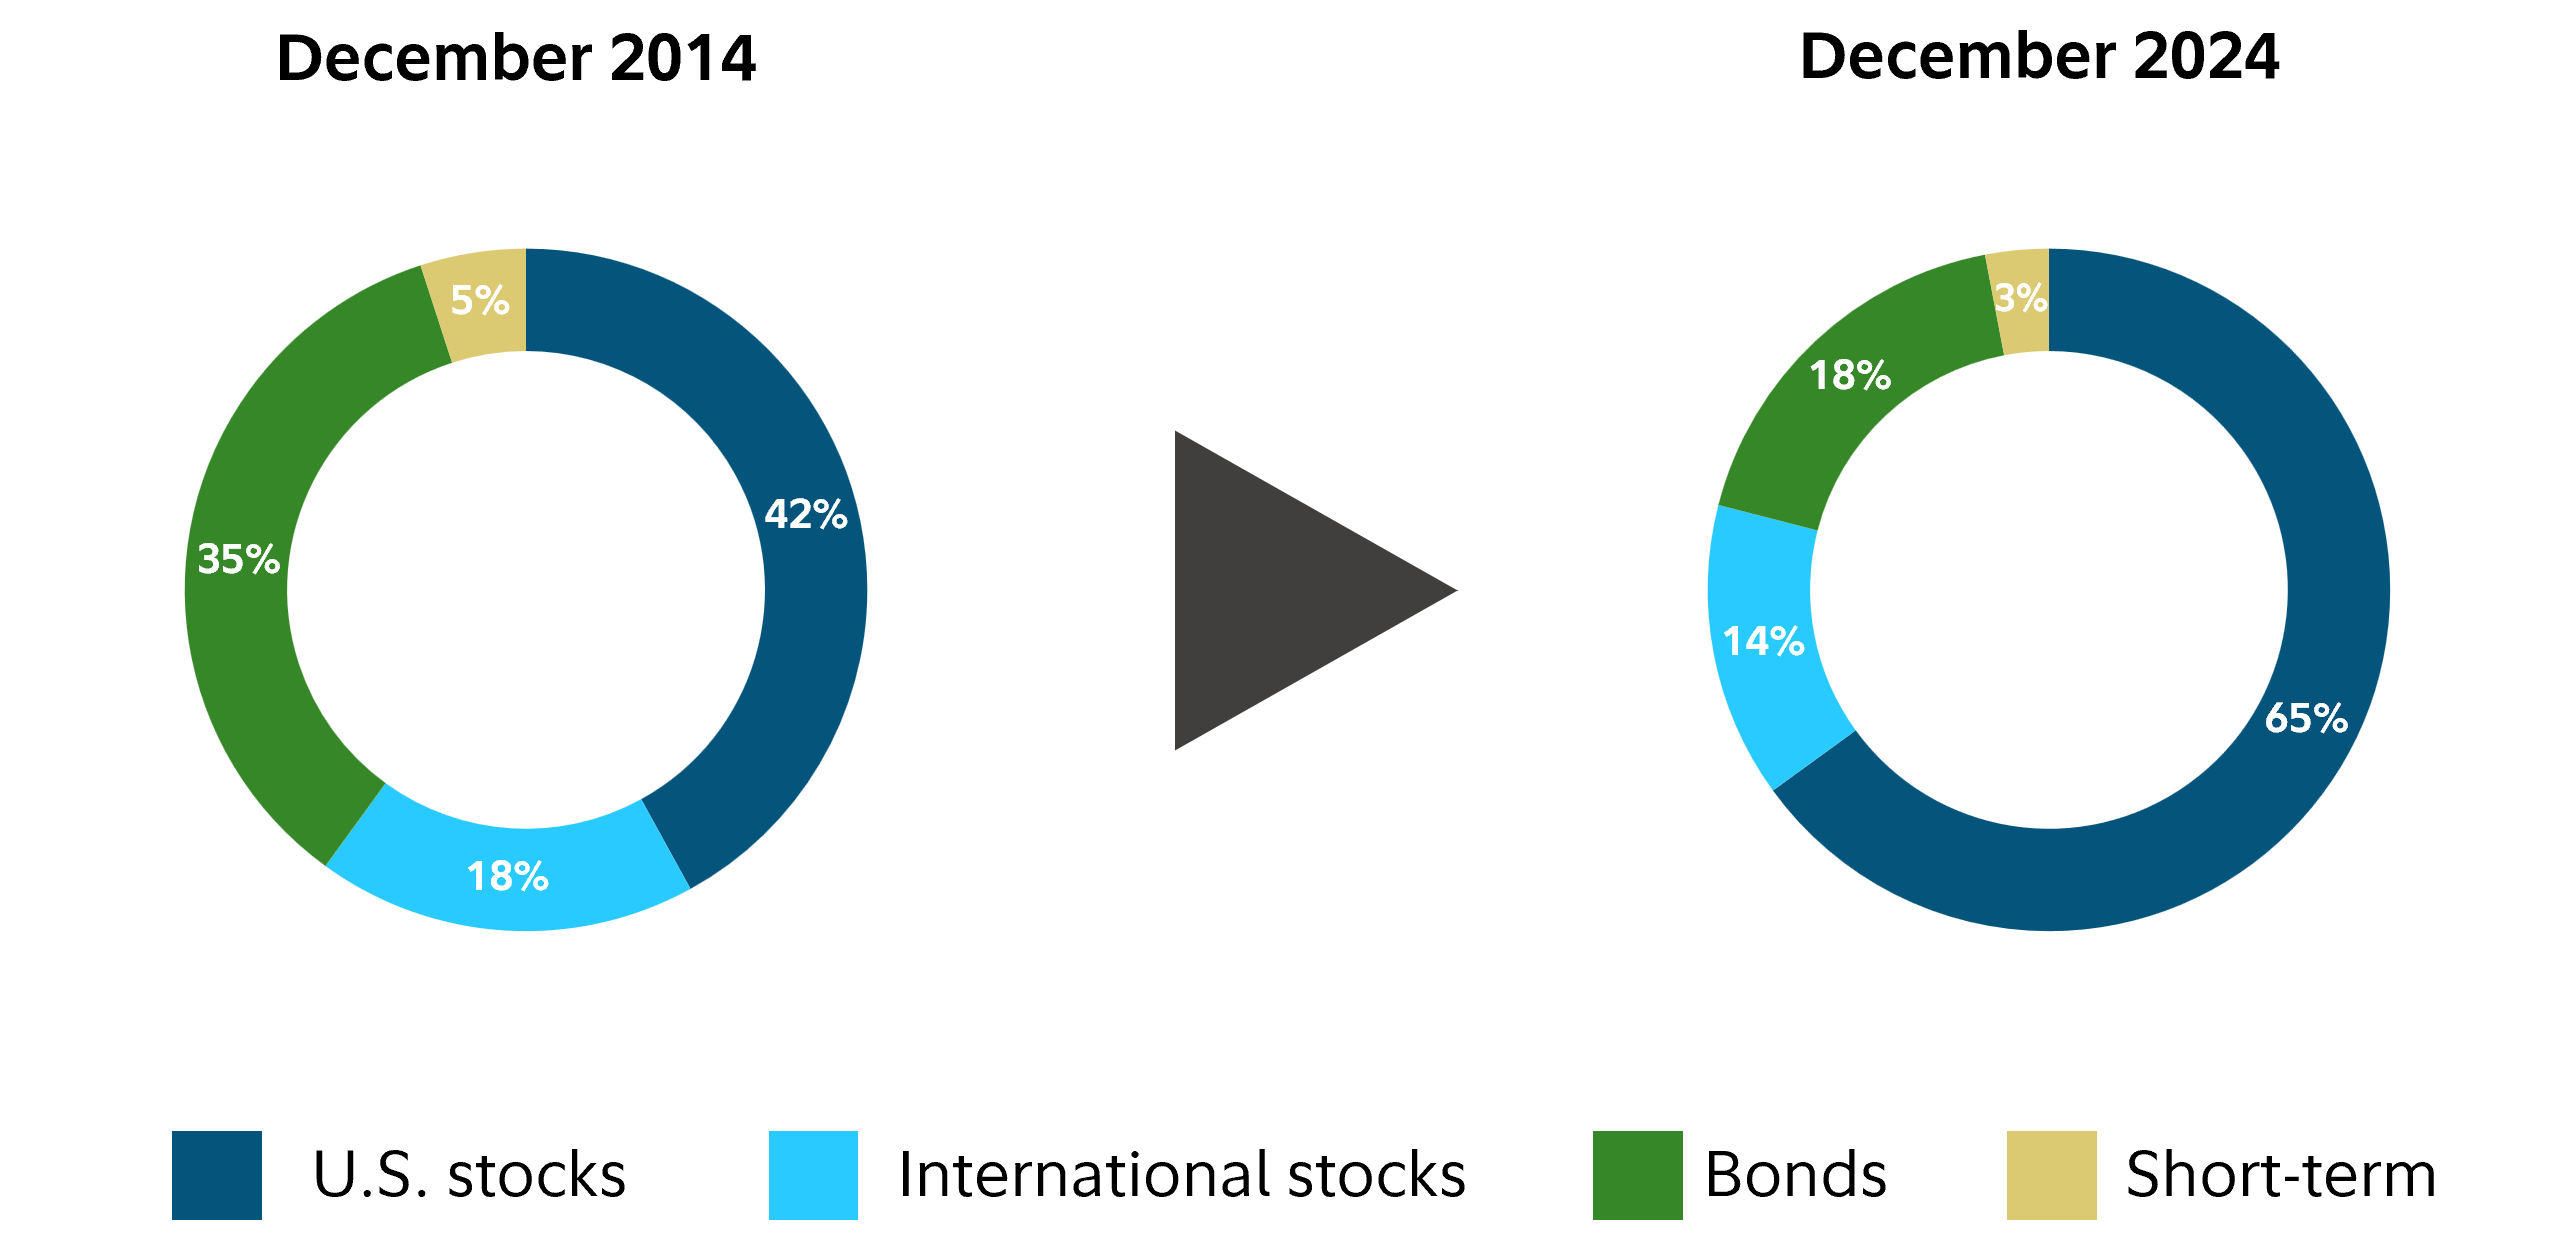
The hypothetical example below shows what can happen when a portfolio isn't properly maintained. Over the course of 10 years, as U.S. stocks increased in value relative to bonds, the portfolio's allocation to U.S. stocks increased from 42% to 65%. While this "drift" could have provided the potential for stronger returns in an up market, they also exposed the investor to greater risk in a down market.
Increased risk as stock markets rise
We believe that the mix of investments in your portfolio should be based on your comfort with risk and aligned to your financial goals, not dictated by market swings. Through a long-term focus on asset allocation, we seek to provide a level of risk that's aligned to your goals to help you stay invested over time.
More information
We continually monitor the level of risk in your portfolio and make adjustments as needed. Through rebalancing, we evaluate opportunities and may periodically buy or sell investments to help restore the appropriate risk and return characteristics of your portfolio.
Hypothetical impact of a market correction
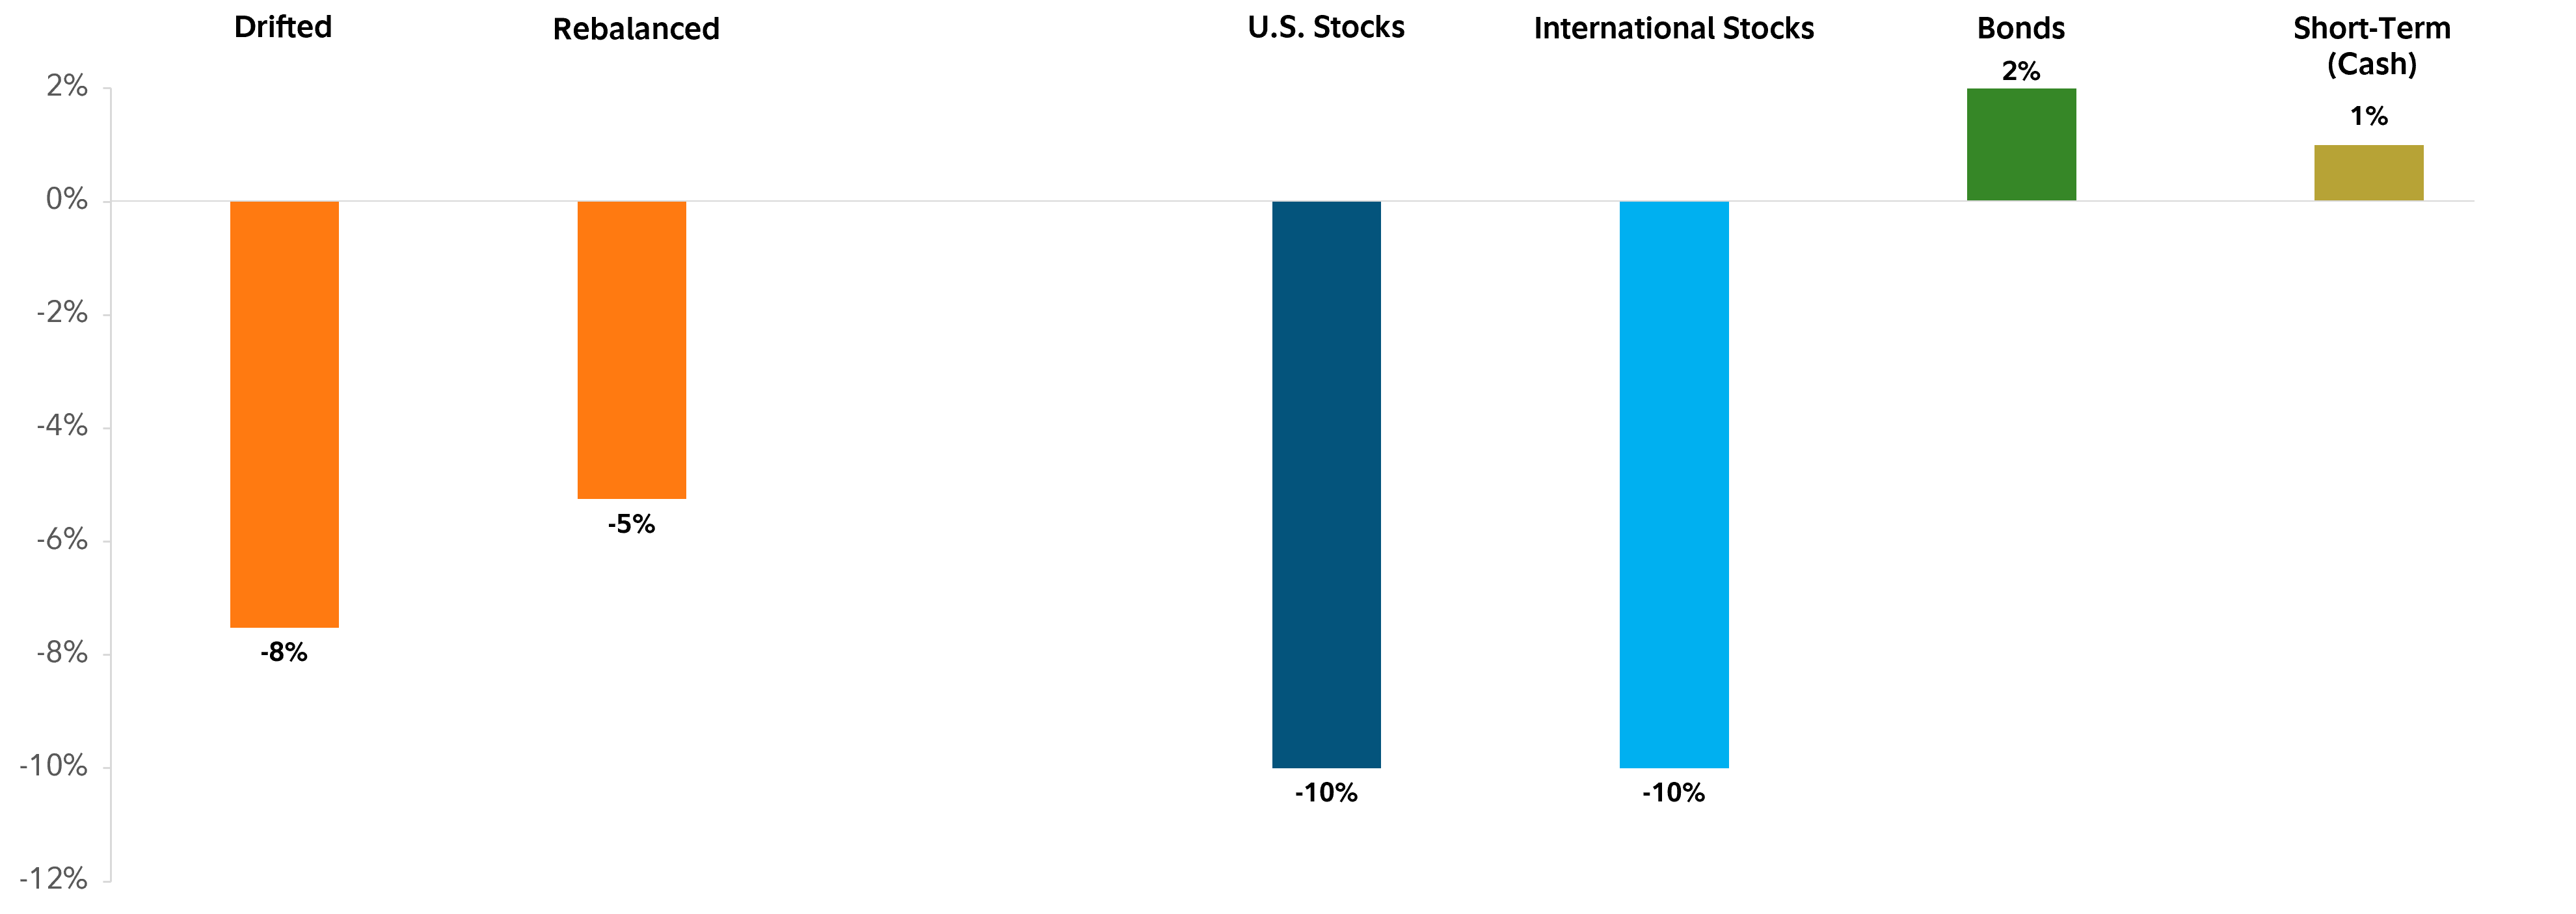
We believe that a portfolio's risk level should be based on your goals and risk tolerance - not by market fluctuations or by inaction. The example above shows one potential benefit of rebalancing based on the hypothetical portfolios in the previous tab: more modest declines during periods of market volatility. In this example, we are showing the hypothetical impact of a market correction, one where US and international stocks declined by 10% each, while bonds and short-term investments experienced modest gains. A portfolio that wasn't rebalanced ('drifted' in the example) experienced more volatility than a portfolio that was regularly rebalanced. Investors who experience less volatility in their investments are generally less likely to abandon their financial plan during periods of market volatility. They are also more likely to experience swifter recoveries in their investments since the declines are usually less deep.
We believe that staying invested through up and down markets can help keep your investment strategy on track. Through disciplined rebalancing, we seek to provide you with a smoother investment experience that's aligned to your goals.
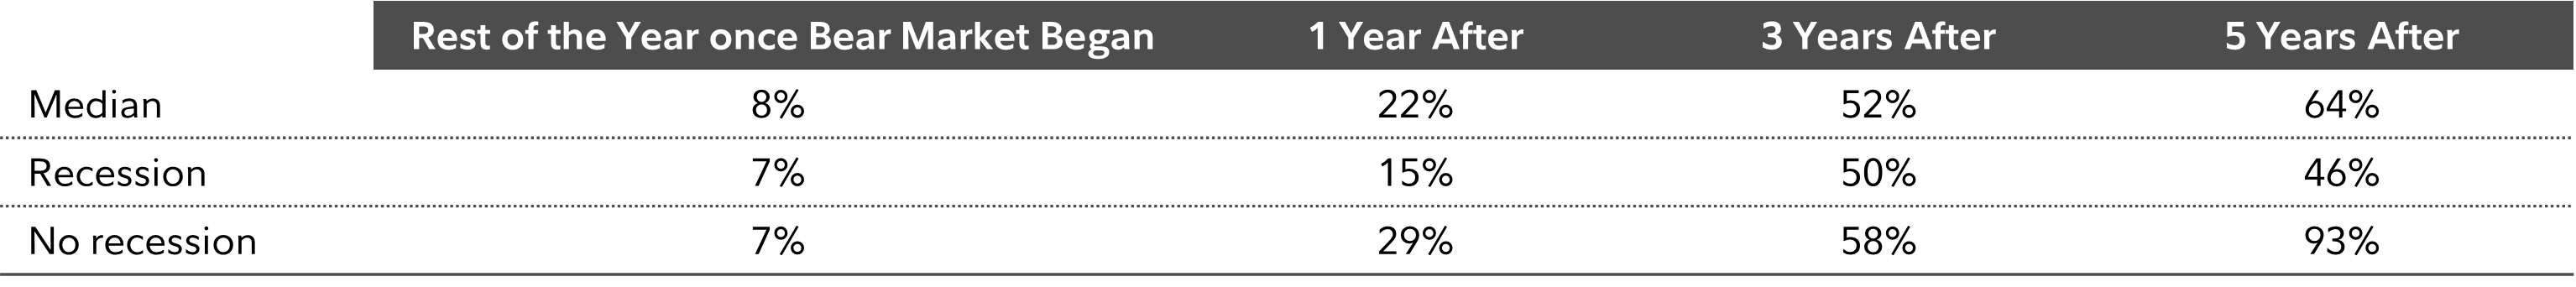
S&P 500 INDEX TOTAL CUMULATIVE RETURNS AFTER A –20% DECLINE BEGAN (1950–2024)
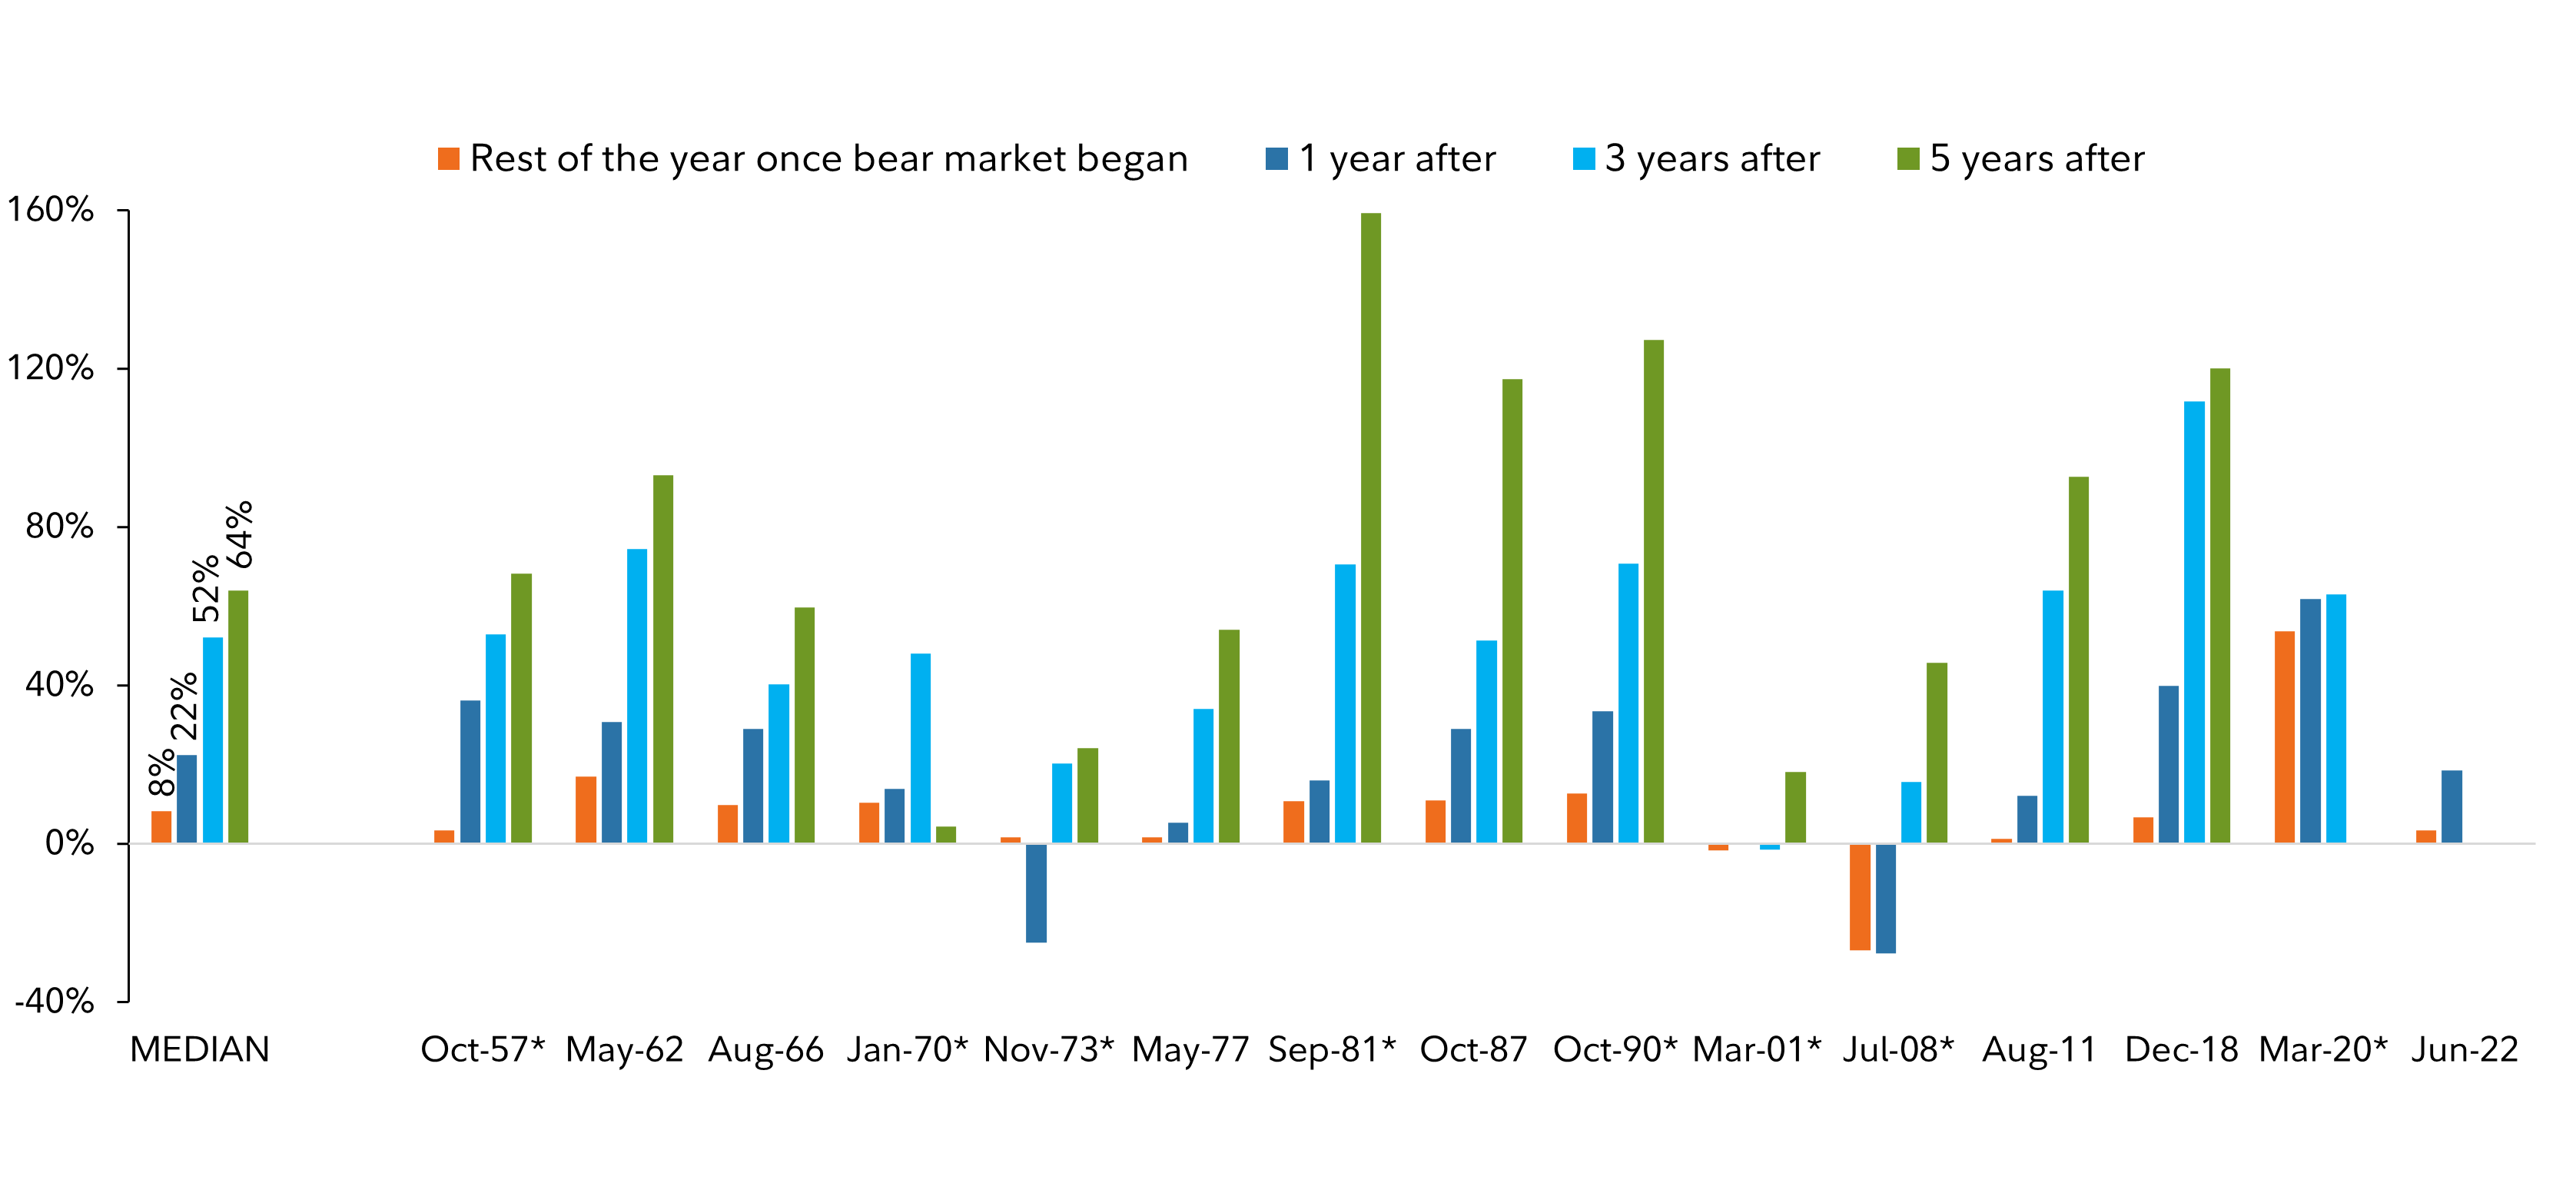
Past performance is no guarantee of future results. Source: Strategic Advisers LLC, Bloomberg Finance, L.P.
* Year recession occurred, as defined by the National Bureau of Economic Research (NBER), as of 12/31/24.
More information
- Rebalancing: A Key Component of Disciplined Investing (PDF)
- Stock Market Performance after Geopolitical Events (PDF)
Portfolio allocations:
Dow Jones U.S. Total Stock Market Index – 42%
Foreign Stocks: MSCI ACWI ex USA Index (Net MA Tax) – 18%
Bonds: Bloomberg: U.S. Aggregate Bond Index – 35%
Short Term: Bloomberg U.S. 3–Month Treasury Bellwethers Index – 5%
The Dow Jones U.S. Total Stock Market Index is an all-inclusive measure composed of all U.S. equity securities with readily available prices. This broad index is sliced according to stock-size segment, style, and sector to create distinct subindexes that track every major segment of the market.
Bloomberg U.S. Aggregate Bond Index: A broad‐based, market value–weighted benchmark that measures the performance of the U.S. dollar–denominated, investment‐grade, fixed‐rate, taxable bond market. Sectors in the index include Treasuries, government‐related and corporate securities, mortgage‐backed securities (MBS) (agency fixed‐rate and hybrid ARM pass‐throughs), asset‐backed securities (ABS), and commercial mortgage‐backed securities (CMBS).
Bloomberg U.S. 3–Month Treasury Bellwether Index: A market value–weighted index of investment‐grade fixed‐rate public obligations of the U.S. Treasury, with maturities of three months, excluding zero coupon strips.
The S&P 500® Index is an unmanaged, market capitalization–weighted index of 500 common stocks chosen for market size, liquidity, and industry group representation to present U.S. equity performance.
The Morgan Stanley Capital International All‐Country World Index (MSCI ACWI ex USA Index (Net MA Tax)) is a market capitalization–weighted index designed to measure the investable equity market performance for global investors of large‐ and mid‐cap stocks in developed and emerging markets, excluding the U.S. Index returns are adjusted for tax‐withholding rates applicable to U.S.‐based mutual funds organized as Massachusetts business trusts.